
Fig. 2.
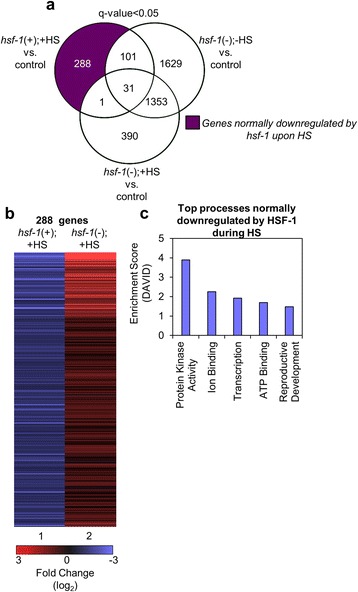
Genes that are normally downregulated by HSF-1 in response to HS. a The Venn diagram shows the overlap among genes that were found to be significantly downregulated (q-value < 0.05) for each of the indicated comparisons between samples. The dark purple shaded area includes genes that are normally downregulated by HSF-1 upon HS. The q-value is the FDR-adjusted p-value of the test statistic, as determined by the Benjamini-Hochberg correction for multiple testing. b Hierarchical clustering of the genes normally downregulated by HSF-1 upon HS. Lane 1 corresponds to the fold change of the 288 genes found in the dark purple section of the Venn diagram in (a) in the hsf-1(+);+HS vs. control samples. As a comparison, lane 2 corresponds to the fold change of the same genes found in lane 1, but in the hsf-1(-);+HS vs control samples, as determined by RNA-seq. The heat map was organized using Cluster 3 by k-means and Euclidean distance. c Top processes normally downregulated by HSF-1 during HS. The genes found in the dark purple section of the Venn diagram in (a) were classified by Gene Ontology terms that were determined using DAVID