Fig. 3.

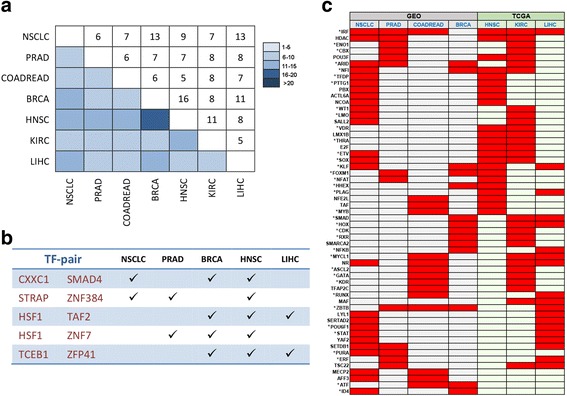
Highly disrupted TFs across diverse cancer types. a Heat map of highly disrupted TF pairs shared across different cancer types. Upper triangle shows the number of common pairs. b A list of highly disrupted TF pairs shared by more than two cancer types. a and b are based on the top 3000 TF pairs with the highest disruption in cooperativity. c Heat map of common highly disrupted TFs across different cancer types. Red bars designate that the TF labeled on the left is identified in the cancer type labeled on the top with greatly disturbed cooperativity with other TFs. Datasets from GSE and TCGA are shaded in different colors. TFs marked with “*” function association with tumor progression
