Fig. 4.

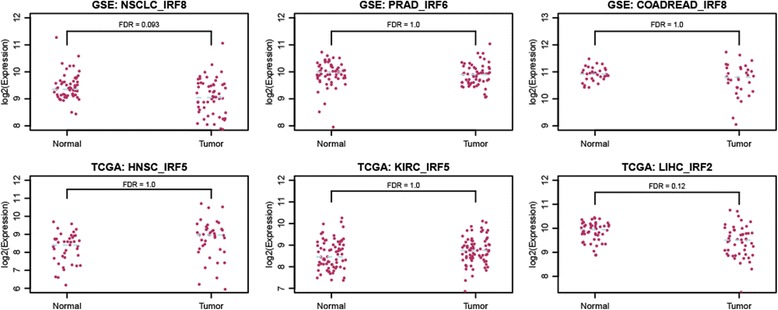
Expression abundance of IRF in tumor versus normal. Each point in the plot represents a sample. FDR is given on the top, and the median concentration in tumor/normal is shown by a dashed line

Expression abundance of IRF in tumor versus normal. Each point in the plot represents a sample. FDR is given on the top, and the median concentration in tumor/normal is shown by a dashed line