
Fig. 6.
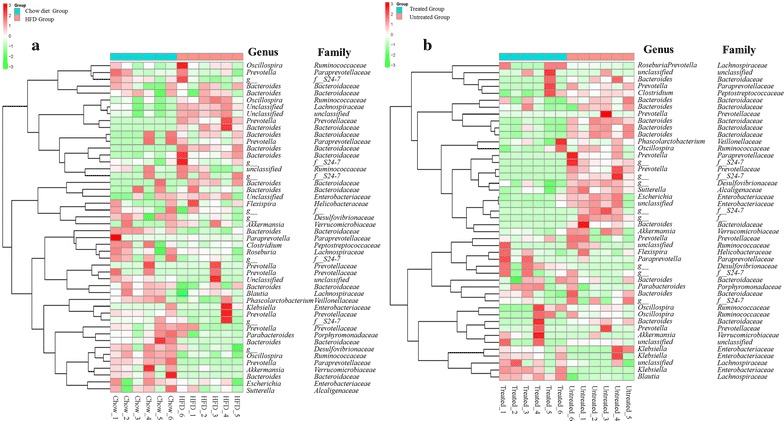
The structure of micorbiota in the feces. Heat map of key OTUs indicating genus-level changes among the groups. The relative abundance of each genus was indicated by a gradient of color from green (low abundance) to red (high abundance). Complete linkage clustering of samples was based on the genus composition and abundance. a Chow group versus HFD group; b BC treated (HFD) group versus untreated group