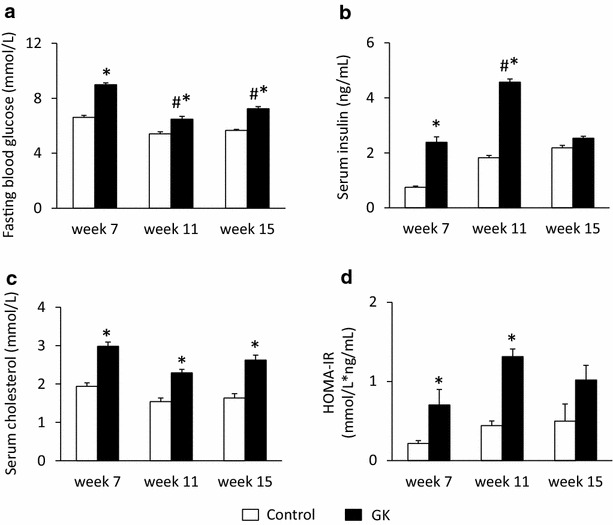
Fig. 1.

Fasting blood glucose, serum insulin and cholesterol levels. Fasting blood glucose (a), serum insulin (b) and cholesterol (c) levels as well as HOMA-IR index (d) at weeks 7, 11 and 15 in both control and GK rats. Values are mean ± SEM, n = 7–9, *p < 0.05 vs. control within the same time point, #p < 0.05 vs. week 7 values
