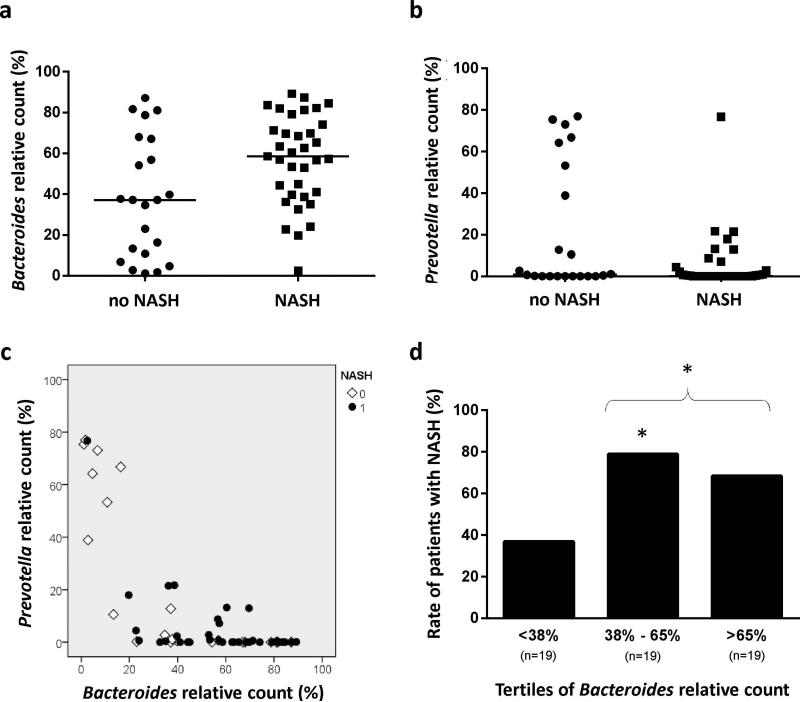
Figure 2. Relationship between NASH at liver biopsy and Bacteroides or Prevotella abundance in the gut.
Figures 2a/2b: NASH patients had higher abundance of gut Bacteroides (p=0.013) and lower abundance of Prevotella (p=0.053). Figure 2c: As these bacteria act as competitors, Bacteroides and Prevotella abundance had an inverse relationship. Figure 2d: Rate of NASH patients as a function of the tertiles of Bacteroides relative count. The rate of NASH was significantly lower in patients with low abundance of Bacteroides (1st tertile). * p≤0.02 vs 1st tertile.

