
Fig. 5.
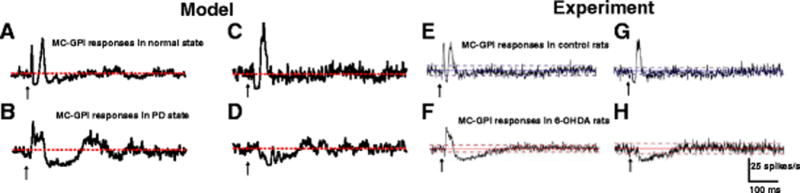
GPi responses to CTX stimulation. (A,C) Model GPi PSTHs obtained under normal conditions show either early excitation, short inhibition and late excitation or short inhibition and late excitation following CTX stimulation. (B,D) Model GPi PSTHs obtained during PD state show either early excitation and long inhibition or only long inhibition following CTX stimulation. (E,F,G,H) Model PSTHs are comparable with PSTHs obtained from an experimental study (Kita & Kita, 2011). The red and blue lines depict the mean firing rate of neurons