
Fig. 8.
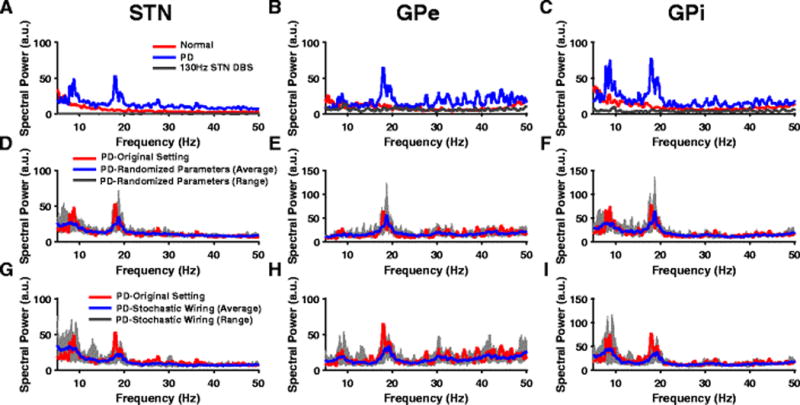
Oscillatory activity across BG nuclei. (A,B,C) Power spectra (PS) of STN, GPe and GPi spike times show exaggerated oscillatory activity in both the alpha and beta band during PD conditions (blue) when compared to the normal state (red). PS show the suppression of these pathological alpha and beta oscillations during HF STN DBS (gray) across all BG nuclei. (D,E,F) PS of STN, GPe and GPi spike times during PD condition show robust oscillatory frequencies across original model parameters (red) and randomized parameters - gm, gcostr, ggege values chosen from an uniform distribution with mean listed in Table 11 (Appendix A). The blue line and gray band represent the average and range respectively across 10 trials. (G,H,I) PS of STN, GPe and GPi spike times during PD condition show robust oscillatory frequencies across original model parameters (red) and a model with stochastic connectivity. Model neurons received synaptic inputs from randomly selected neurons. The blue line and gray band represent the average and range respectively across 10 trials