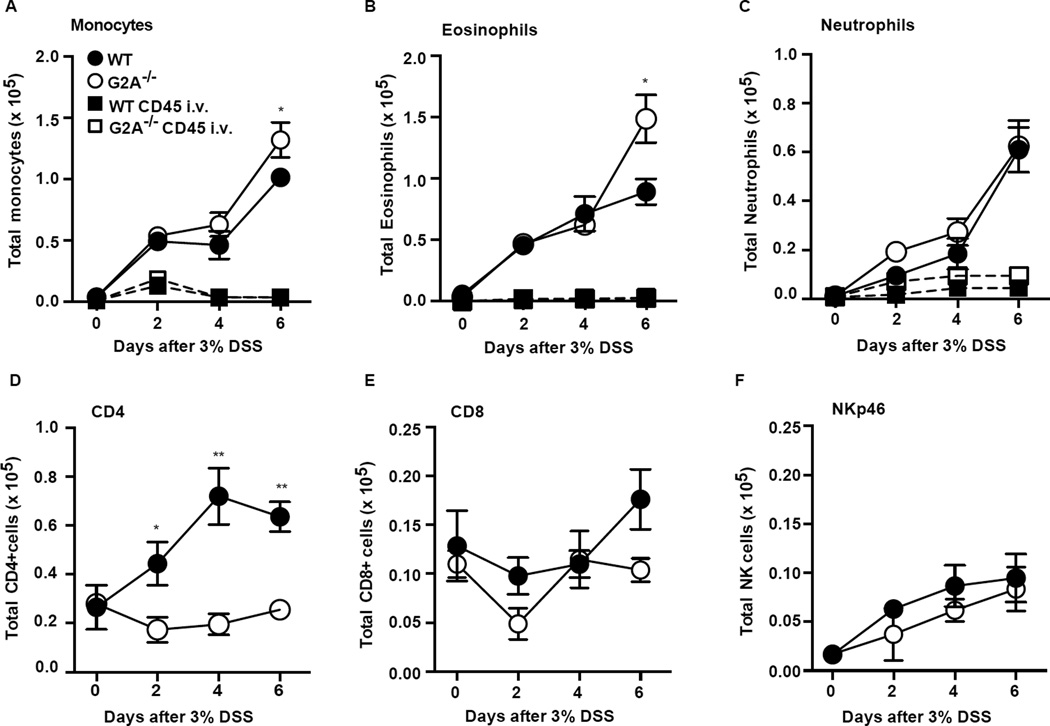
Figure 2. G2A−/− mice show altered recruitment of immune cells over the course of DSS-induced colitis.
A–F, immune cell types were determined by flow cytometry following digestion as described in Experimental Procedures. Gating strategy is described in Experimental Procedures and Supp. Fig. 1E. Note differences in scale. Square symbols denote myeloid cells tagged with i.v. anti-CD45 (See Experimental Procedures). Data represent mean ± SEM; n=8–10, *p<0.05 compared to WT; **< 0.01 compared to WT.

