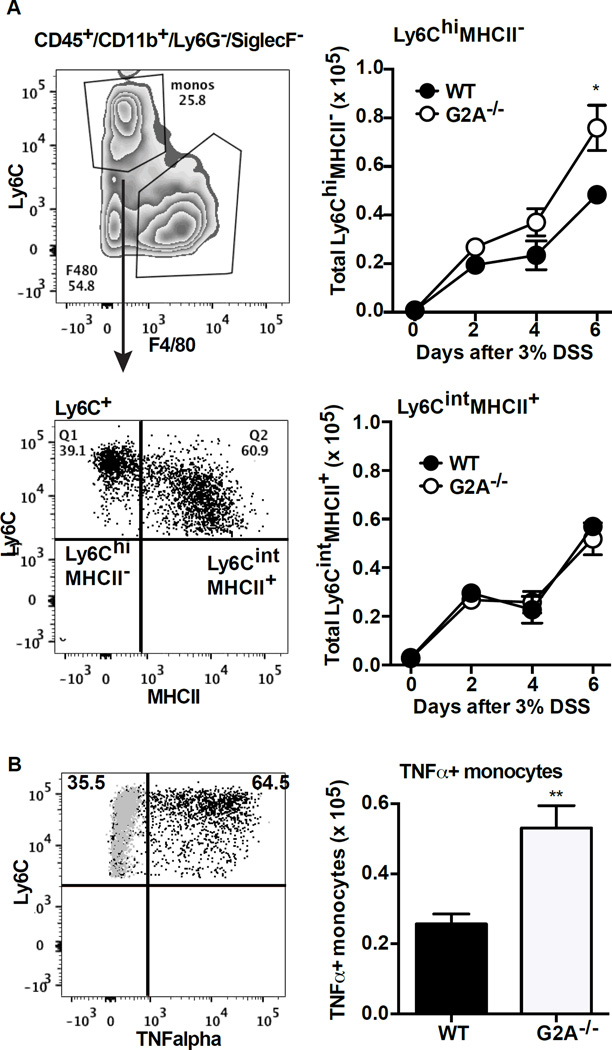
Figure 4. G2A−/− mice have more TNFα+ pro-inflammatory monocytes during DSS-induced colitis than WT.
A, representative flow cytometry plot demonstrating gating strategy to separate Ly6ChiMHCII− from Ly6CintMHCII+ monocytes (left). Total Ly6ChiMHCII− and Ly6CintMHCII+ monocytes were determined by multiplying the percentage by the total number of monocytes from Fig. 2 (right). Data represents mean ± SEM; n=10, *p<0.05 compared to WT. B, representative flow plot demonstrating intracellular TNFα staining in the Ly6C positive monocytes (left). Gray dots are isotype antibody controls. Total numbers of TNFα+ monocytes (right) was determined by multiplying the percentage of TNFα+ cells by the total number of monocytes from Fig.2. Data represents mean ±SEM; n=10, ** p<0.01 compared to WT.

