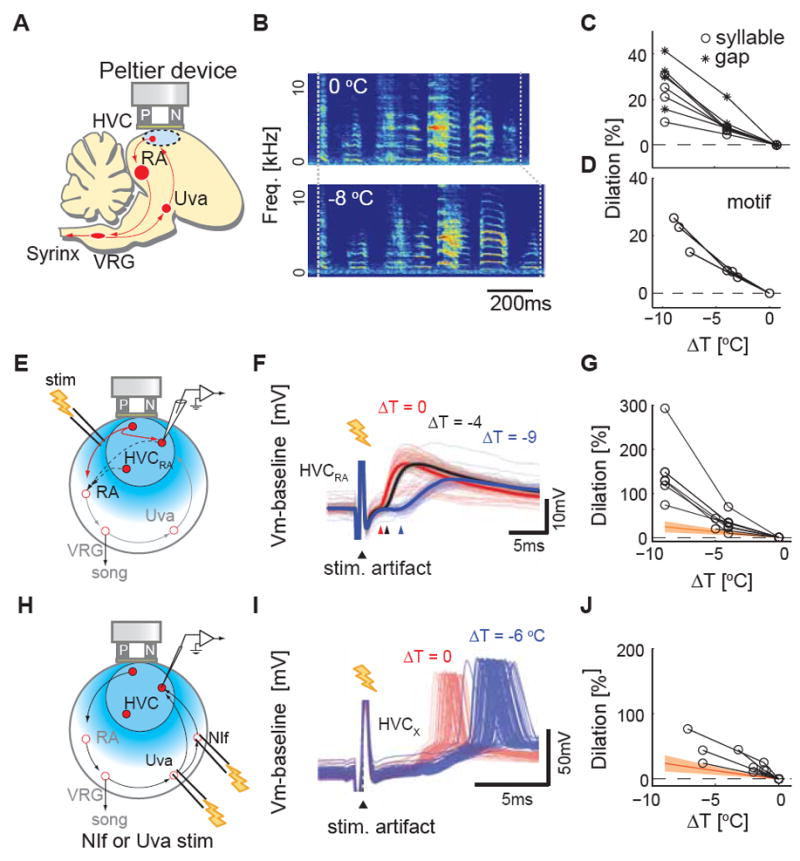
Figure 2. Temperature exerts markedly different effects on synaptic transmission in HVC and on song timing.

A, Schematic diagram of HVC surface cooling. B, A typical example of the effects of bilateral HVC cooling on song timing. C, Typical examples of temperature dependence of syllable and gap durations measured from one adult male zebra finch. Both syllables and gaps slow 20-40% per 10 °C (Q 10 = 1.2-1.4). D, Motif, the typical syllable sequence sang by a zebra finch, also stretches to the similar extent (n = 3 birds, Q10 = 1.25 ± 0.03). E, Schematic diagram of the experimental setup to measure local HVCRA - HVCRA interactions. F, An example of the effect of HVC surface cooling on synaptic transmission between HVCRA cells (ΔT = 0 °C (red), ΔT = - 4 °C (black), ΔT = -9 °C (blue)). Thick solid lines are trial aver aged membrane potential trace, thin lines are individual traces; arrowheads mark average synaptic potential onsets at different temperatures. G, Cooling HVC slows synaptic transmission between HVCRA neurons by 75-300% per 10 °C. Synaptic onset laten cies (n=9 HVCRA): 2.9 ± 0.5 ms at ~40 °C versus 5.7 ± 0.6 ms at ~32 °C). Note the difference of y-axis scales in Figure 2C and 2F, 2I. H, Schematic diagram of the experimental setup to measure orthordomically evoked latencies. I, Examples of typical dilation effect of HVC surface cooling on the action potential responses to stimulation of HVC afferents (Uva, n = 6; NIf, n = 1). J, Manipulating HVC temperature increases action potential latencies (n = 3 HVCRA, n = 4 HVCX); 5.8 ± 0.8 ms at ~40 °C versus 8.6 ± 0.8 ms at ~3 2 °C, mean ± SEM. Orange hatched region represents the range of Q10 of syllables and gaps; 1.27 ± 0.14 (mean ± SD).
