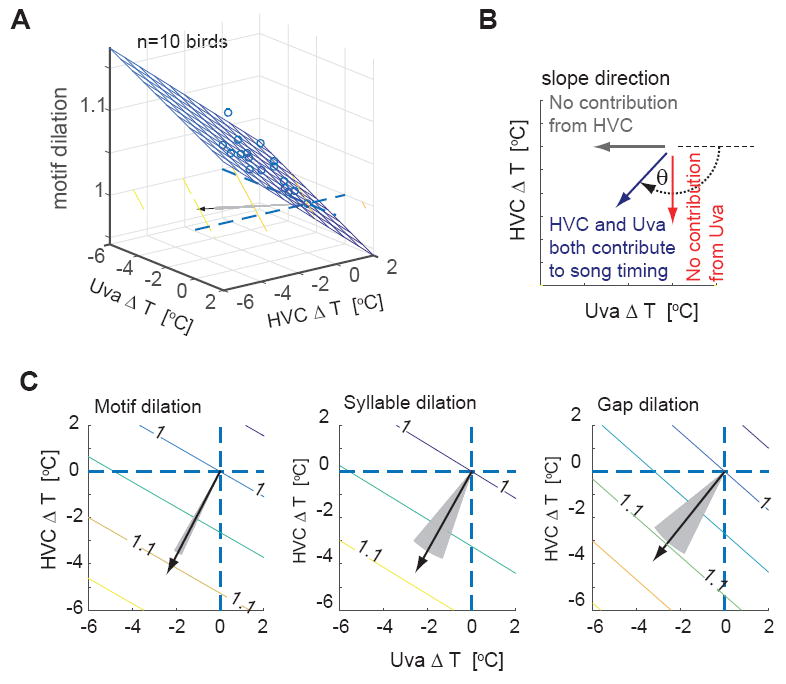
Figure 5. Linear regression analysis revealed significant contribution from Uva on song timing control.

A, Linear regression analysis of the motif dilation. The slope of the regression plane is indicated by a vector (black arrow). B, The angle θ of the slope vector represents the contributions from HVC and Uva. C, The slope vectors for motif, syllables, and gaps, which are shown with equivalent lengths, were well separated from both the HVC and Uva axes (p<0.01), indicating that both HVC and Uva contribute significantly to song timing. (Motif: θ = -0.65 π ± 0.02, ratio (HVC/Uva contribution) = 1.90 ± 0.33; Syllable: θ = -0.67 π ± 0.09, ratio = 1.80 ± 1.05, Gap: θ = -0.70 π ± 0.07, ratio = 1.36 ± 0.71 (mean ± 3SD). The slope vectors were closer to the HVC temperature axis (vertical dashed line) than the Uva temperature axis (horizontal dashed line), suggesting that the contribution to song timing from HVC is relatively stronger than that from Uva. Gray shaded region; 2SD region calculated using a bootstrapping method.
