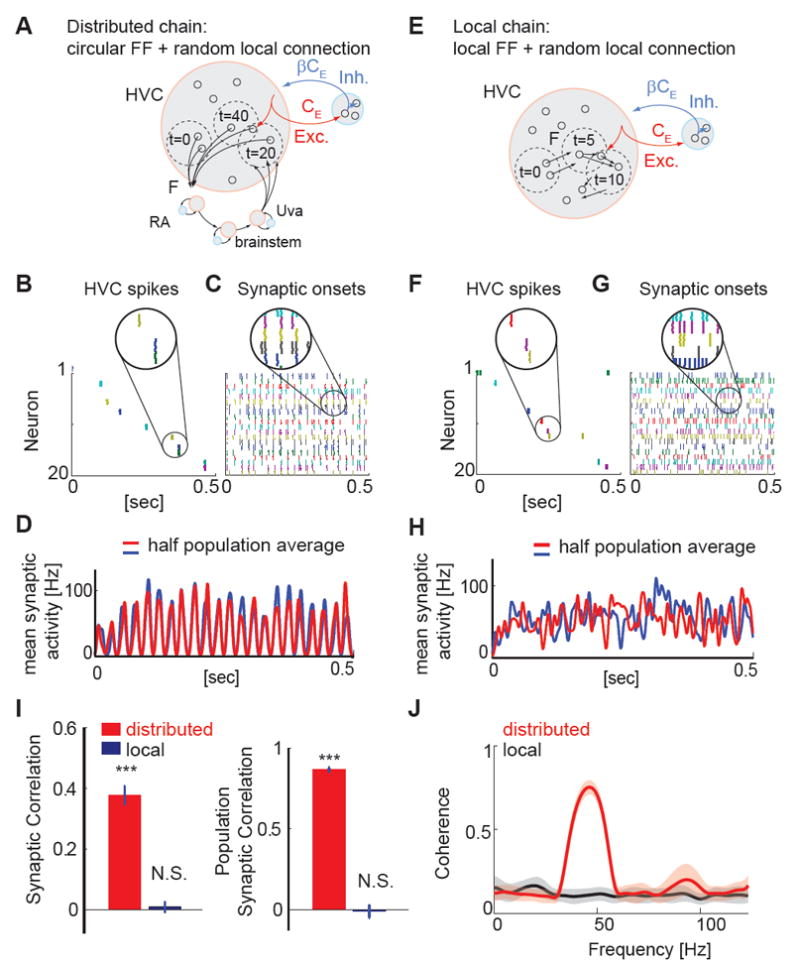
Figure 6. Simulations of local and distributed chain models can generate sparse sequential activity, but with different levels of correlated synaptic activity in HVC.

A, Schematic showing the structure of the distributed chain network: The excitatory neurons are grouped into four pools, representing HVC, RA, VRG, and Uva. Excitatory neurons form feedforward connections to the next group. The excitatory neurons and inhibitory neurons also form random recurrent connections within the group. F is the ratio of active neurons engaged in the chain of action potential activity. CE (βCE) is the number of presynaptic excitatory (inhibitory) neurons per single neuron in the form of random connections. B, C, Spike rastergrams (B) and synaptic onset rastergrams (C) of 20 randomly selected neurons, constructed from 5 runs of simulations. Only HVC neurons are shown. D, Population averaged synaptic onset activity calculated from half of the population (red, n=10) and from the other half of the population (blue, n=10). In the distributed chain model, the temporal profiles of population synaptic activity are highly similar. E, Local chain model: Groups of excitatory neurons form feedforward connections (FF) and excitatory and inhibitory neurons also form random recurrent connections. F, G, same as B, C. H, Population averaged synaptic onset activity calculated from each half of the randomly selected 20 neurons. In the local chain model, there is no obvious temporal structure common in the two groups of neurons. I, Left: Synaptic correlation (the correlation coefficient of the simulated synaptic onset patterns) of pairs of neurons revealed significant non-zero correlations in the distributed chain model (P < 0.001), but not in the local chain model (P = 0.66). Right: Population synaptic correlation (the correlation of population averaged synaptic event rates) of two randomly selected groups of neurons in either the distributed chain model (P < 0.001) or the local chain model (P = 0.73). Data were generated from the average of 5 realizations of networks, each containing 5 runs of simulations. t-test. J, Magnitude-squared coherence spectrum of the synaptic event rate calculated from pairs of simulated neurons (n = 10 cells). Neurons in the distributed chain model exhibited a clear peak around ~40 - 50 Hz reflecting the periodic occurrence of synaptic inputs at ~20 - 25 msec intervals. In contrast, a coherence analysis of neurons in the local chain model revealed no clear indication of periodicity within the 0 - 100 Hz range.
