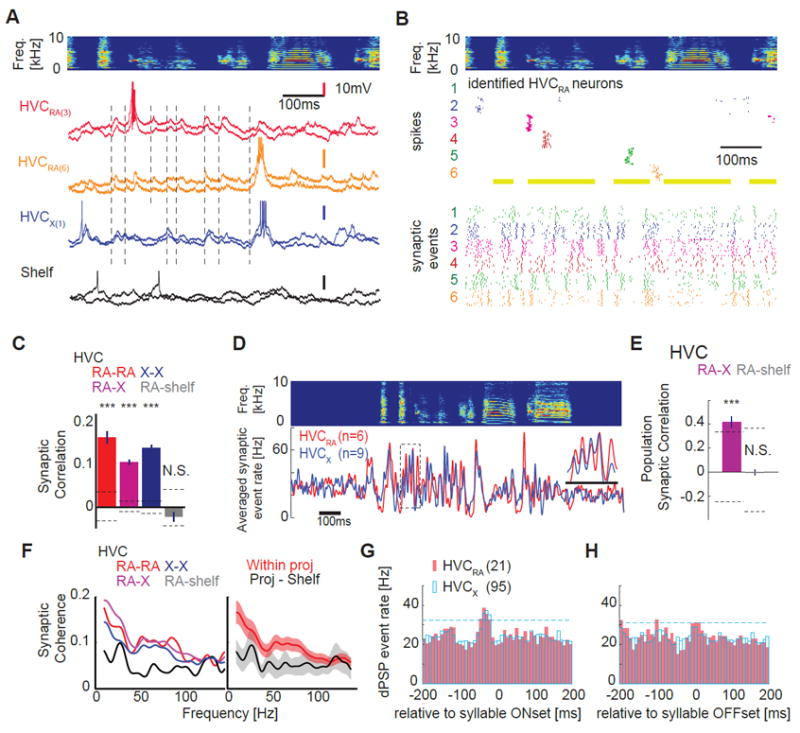
Figure 8. Correlated, high frequency synaptic activity underlies temporally sparse, sequential action potential patterns in HVC.

A, Top: sonogram of a single motif. Bottom: Examples of precisely timed membrane potential traces from different HVC PNs and a cell outside of HVC (HVC shelf) during singing; membrane potential records from two motif renditions are shown (light versus dark color), with different colors corresponding to different cells (HVCRA (3) and HVCRA (6) corresponds to cell #3 and #6 in Figure 8B). Occurrences of correlated synaptic onset timings are highlighted with vertical dashed lines. B, Motif-aligned sequential action potentials (middle) and synaptic onsets (bottom) in six identified HVCRA neurons recorded from the same zebra finch; neurons with at least ten motif renditions are selected, with different colors depicting different neurons. C, Synaptic event timings between individual HVC projection neurons are all correlated (significantly non-zero); HVCRA - HVCRA pairs (red; Correlation Coefficient (CC) = 0.17 ± 0.04; n = 25 pairs, P < 0.001, t-test compared with shuffled data); HVCX - HVCX pairs (blue; CC = 0.11 ± 0.01; n = 177 pairs, P < 0.001); HVCRA – HVCX pairs (purple; CC = 0.14 ± 0.02; n = 137 pairs, t-test, P < 0.001). No significant difference was detected between different PN pairs (P > 0.15). No significant correlation in synaptic activity was detected between cell pairs involving HVCRA cells and cells outside of HVC (Shelf, gray; CC = -0.02 ± 0.03; n = 15 pairs, P = 0.32). Dashed lines: 3SD from shuffled data. Error bars: SE. D, Averaged synaptic event rates obtained from the same bird showed striking similarity of input timings between two the projection neuron classes (HVCRA and HVCX cells). E, The temporal structure of synaptic input timings are highly similar in HVCRA and HVCX populations (purple; HVCRA – HVCX groups; n = 4 birds, CC = 0.41 ± 0.13, P < 0.001) but not in HVCRA and Shelf populations (gray; HVCRA – HVC shelf groups; n = 4 birds, CC = 0.01 ± 0.07, P = 0.95). Dashed lines: 3SD generated from shuffled data. F, Left: the magnitude-squared coherence spectrum calculated from pairs of HVC neurons (same color codes as in C) showed a broad peak ~ 50 Hz, which was not evident in HVCRA - HVC shelf neuron pairs. Right: grouped average of magnitude-squared coherence calculated within HVC projection neurons (red) and between HVC projection neurons and HVC shelf neurons (black). G,H, Synaptic events precede sound onsets but not offsets in both HVCRA and HVCX cell types. dPSP peak at -37.6 ± 0.48 ms (n=21 HVCRA), -33.1 ± 0.15 ms (n=95 HVCX). Dashed lines are 2 SD of dPSP rate. A subset of HVCX cell data was presented in [Hamaguchi and Mooney 2014].
