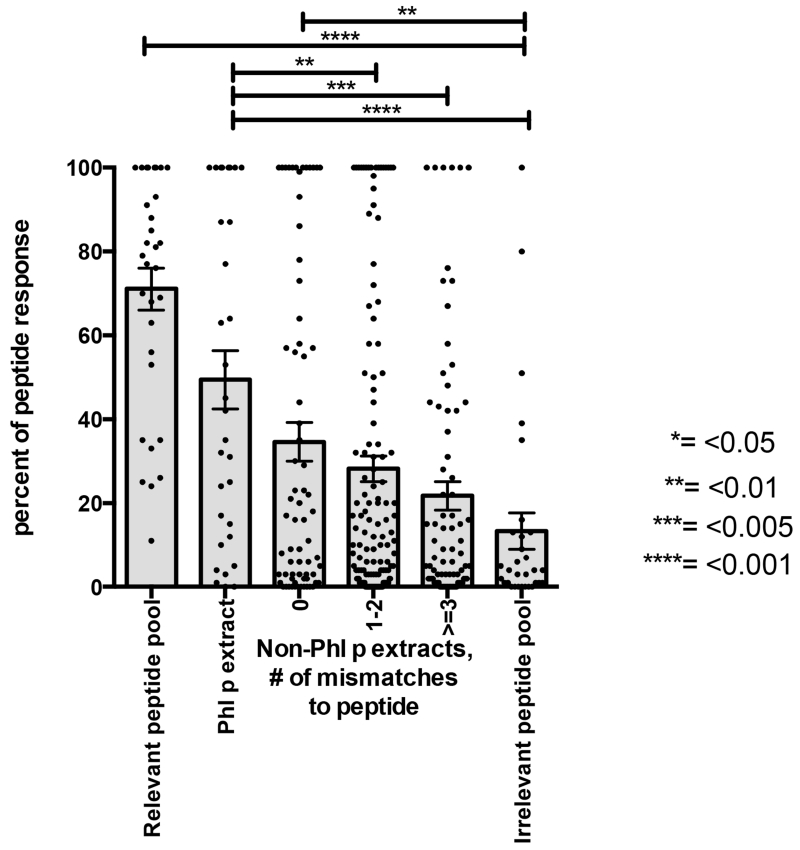
Figure 3. Conservation in transcriptome predicts peptide cross-reactivity.
For each peptide, Phl p allergic donors were selected that reacted to the peptide after expanding PBMCs in vitro with Phl p extract. PBMCs were stimulated with individual peptides for 14 days and IL-5 responses were measured by ELISPOT to i) the peptide itself, ii) Phl p extract, iii) the nine non-Phl p extracts for which transcriptomes were available, iv) peptide pools (P20 and P19) that did or did not contain the peptide, as relevant and irrelevant controls. T-cell cultures that did not induce a robust response above 200 SFC to the peptide itself were excluded (30% of cultures). Reponses to extracts and peptide pools are expressed as the relative fraction of the response to the peptide itself, and capped at 100%. Each grey bar represents the average response +/− SEM. Asterisks indicate p-values of statistical significance as indicated on the right according to one-tailed Mann-Whitney tests.

