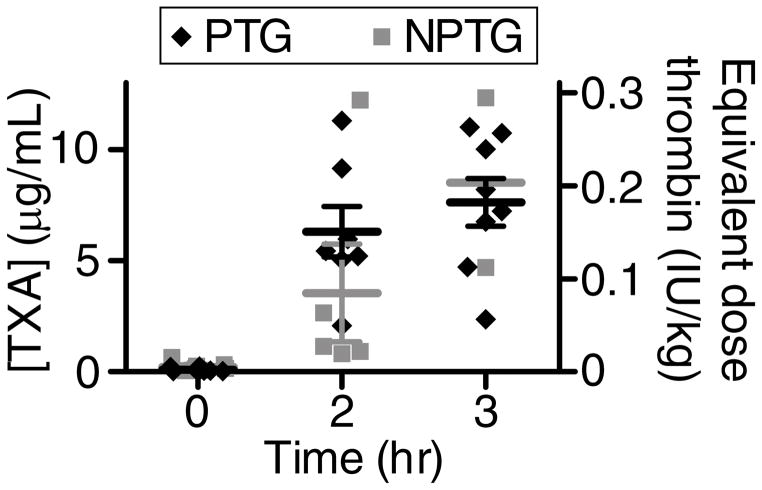
Figure 4. Plasma TXA concentrations and estimated systemic thrombin doses for pigs receiving PTG or NPTG.
(A) Plasma concentrations of TXA (left y-axis) in pigs receiving PTG or NPTG and estimated, corresponding systemic doses of absorbed thrombin (right y-axis). n = 2–8. Error bars represent SEM for timepoints and treatment groups where n≥3.

