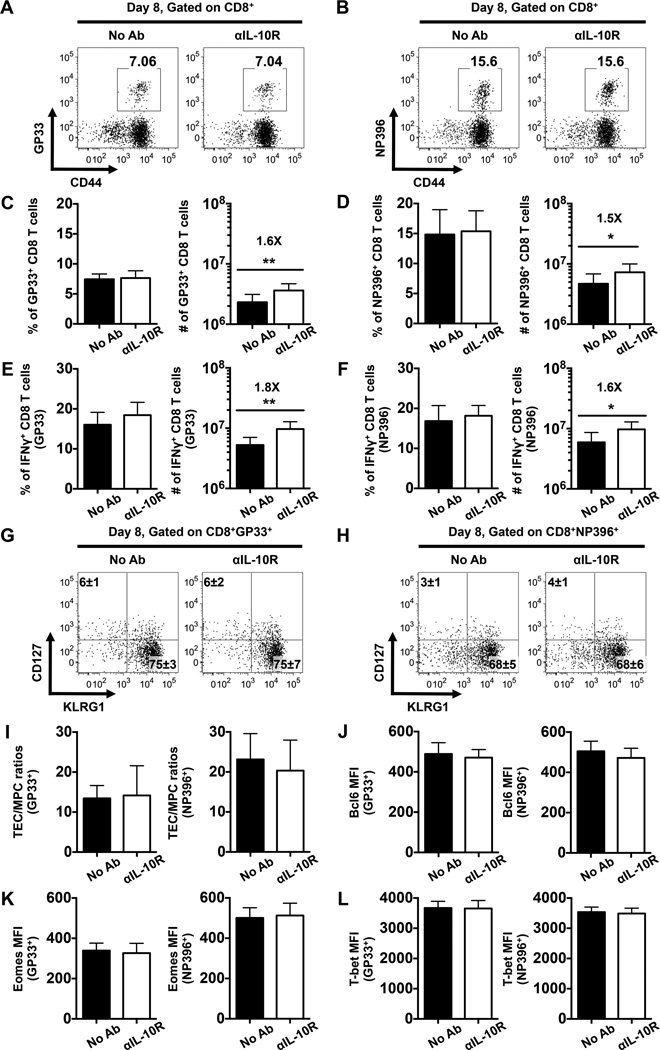
FIGURE 5.
IL-10 signaling during the priming phase of infection does not control the differentiation of effector CD8 T cells. WT mice were either left untreated or treated with αIL-10R antibodies at days 0, 2, 4, and 6 following LCMV infection, splenic CD8 T cells were then analyzed at day 8 following infection. (A-B) Representative dot plots show the percentages of LCMV (A) GP33-specific or (B) NP396-specific tetramer binding CD8 T cells. (C-D) Bar graphs show the percentages (left panel) or numbers (right panel) of (C) GP33- or (D) NP396-specific CD8 T cells. (E-F) Bar graphs show the percentages (left panel) or numbers (right panel) of IFNγ-producing CD8 T cells assessed by intracellular staining following stimulation with the (E) GP33-41 or (F) NP396-404 peptides. (G-H) Representative dot plots show the expression of CD127 and KLRG1 on gated (G) GP33- or (H) NP396-specific CD8 T cells. Numbers indicate the percentages ± SD of MPCs (CD127highKLRG1low) and TECs (CD127lowKLRG1high) tetramer-binding CD8 T cells. (I) Bar graphs show the ratios of GP33- (left panel) or NP396-specific (right panel) TECs to MPCs. (J-L) Bar graphs show the MFI of (J) Bcl6, (K) Eomes, and (L) T-bet levels in GP33- (left panel) or NP396-specific (right panel) CD8 T cells. Representative or composite data are shown from two independent experiments analyzing 9–10 mice per group. *p < 0.05, **p < 0.01. Error bars show SD.

