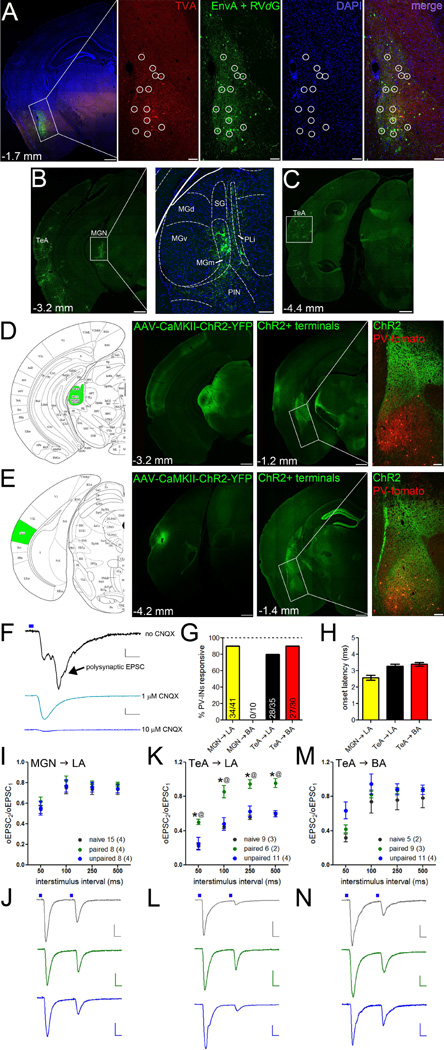
Figure 5. Presynaptic origins of internal and external capsule plasticity.
A. AAV-FLEX-TVA-mCherry and the rabies glycoprotein was unilaterally injected into the basolateral amygdala of PV-IRES-Cre mice to restrict subsequent expression of EnvA+RVdG-eGFP to PV-INs and their monosynaptic retrograde partners. Confocal images of the injection site (boxed portion on left) are enlarged in the right panels. Retrograde labeling only occurred from PV-INs that coexpressed mCherry (red) and eGFP (green; circles). B–C. eGFP-positive cell bodies were observed in temporal association cortex (TeA; B–C) and the medial portion of the medial geniculate nucleus (MGN; B). The boxed portion of the MGN on left is enlarged in the right panel. MG dorsal (d), ventral (v), and medial (m); suprageniculate nucleus (SG); posterior limitans nucleus (PLi); posterior intralaminar nucleus (PIN). D–E. AAV-CaMKII-ChR2-eYFP was injected into the MGN (D) and TeA (E) of PV-IRES-Cre mice crossed to ROSA-tdTomato reporter mice to target PV-INs for electrophysiological recordings without exciting ChR2. eYFP-positive terminal expression shown in right panels with the boxed portion representing the enlarged images of basolateral amygdala to the right. Scales = low magnification, 500 µm; enlargements, 100 µm. F. Optic-evoked EPSCs (oEPSCs) were conducted in the presence of 10 µM CPP and 1 µM CNQX to prevent polysynaptic activity and isolate monosynaptic currents. oEPSCs were abolished by saturating CNQX (10 µM). Scales = 10 pA × 10 ms. G. Terminal stimulation elicited oEPSCs from both pathways onto LA PV-INs; only TeA oEPSCs were observed in BA PV-INs. H. Onset latency of oEPSCs was consistent with monosynaptic transmission in both pathways. I–J. Fear learning did not alter PPR of oEPSCs at MGN → LA PV-IN synapses. Representative traces in J. K–N. PPR of oEPSCs at TeA → PV-IN synapses was increased in paired compared to unpaired and naïve mice in LA (K, representative traces in L) but not BA (M, representative traces in N). J,L,N representative traces shown at the 50 ms interstimulus interval. Scales J,L,N = 10 pA × 50 ms. n/group indicated on graphs. I,K,M repeated-measured ANOVA followed by Holm-Bonferroni. Data presented as mean ± SEM.

