
Figure 1. Predictive performance of ANN predictors of pMHC-I complex stability.
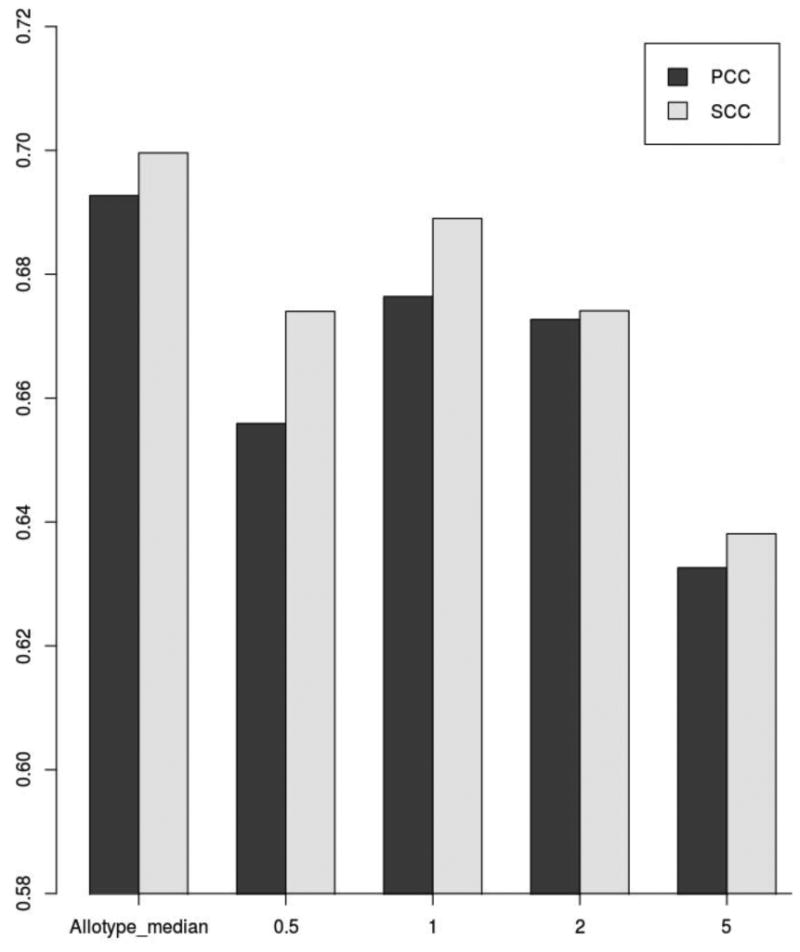
The graphic shows the average PCC,and SCC values for the predictors trained with different t0 thresholds.
Official websites use .gov
A
.gov website belongs to an official
government organization in the United States.
Secure .gov websites use HTTPS
A lock (
) or https:// means you've safely
connected to the .gov website. Share sensitive
information only on official, secure websites.
The graphic shows the average PCC,and SCC values for the predictors trained with different t0 thresholds.