
Figure 2. Performance of epitope/ligand predictions in terms of AUC.
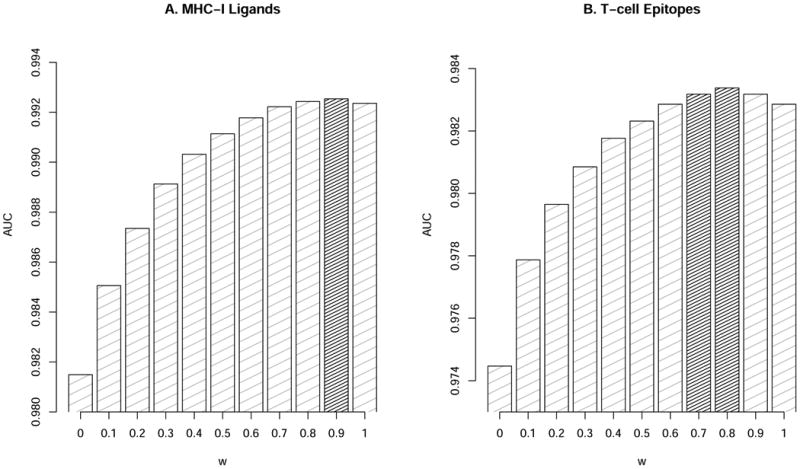
Predictive performance for the stability (w=0) and affinity (w=1) predictors and their combinations for (A) MHC-I Ligands and (B) T-cell Epitopes. The grey columns show combinations with significantly improve (p<0.05) performance compared to both affinity alone (w=1), and stability alone (w=0) and in-significant difference (p>0.05) compared to the optimal model (the value of w with highest AUC value). Statistical differences were evaluated using binomial test excluding ties.