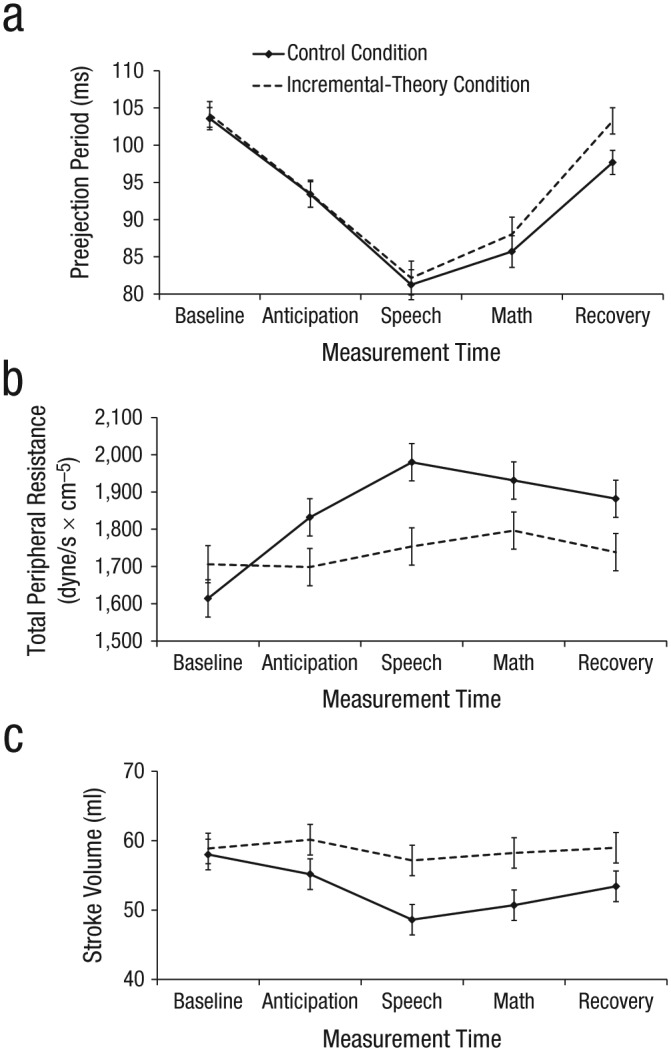
Fig. 2.

Mean (a) preejection-period interval, (b) total peripheral resistance, and (c) stroke volume in Study 1 as a function of measurement time and condition. Each factor was measured at baseline, prior to the speech and math tests (anticipation period), during each test, and at recovery. Error bars show ±1 SEM.
