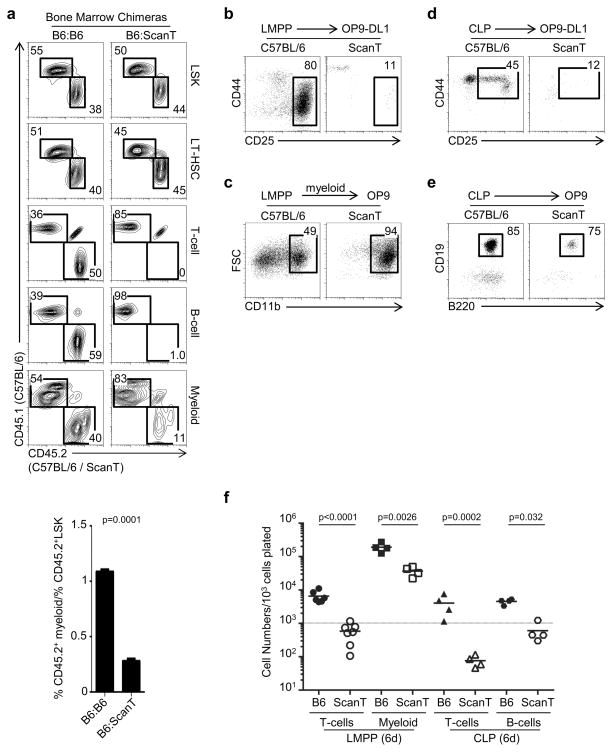
Figure 1. Zbtb1 is required for the generation of normal numbers of lymphoid and myeloid cells.
a) FACS analysis of mixed bone marrow chimeras generated with a 1:1 mixture of CD45.1+(C57BL/6):CD45.2+(C57BL/6 or ScanT) donor cells. Donor chimerism is identified in LSK (Lin−Sca1+cKit+) and LT-HSC (Lin−CD150+Flt3− Sca1+cKit+) cells in bone marrow and T-cells (TCRβhi), B-cells (CD19+) and myeloid cells (CD11b+) in spleen. The numbers represent the proportion of cells within the indicated gates. Below is the quantitation of the proportion of myeloid/LSK cells derived from CD45.2+ cells. Data was calculated by dividing the % of CD45.2+CD11b+ in spleen by the % of CD45.2+LSK in bone marrow from each mouse and data of 4 independent chimeras for each condition is represented. Three independent experiments with 3–4 chimeras per condition were performed with similar results. b) FACS analysis of LMPP cells co-cultured with OP9-DL1 cells in the presence of lymphoid (IL-7 and Flt3l) cytokines for 15 days to initiate T-cell development. The numbers indicate the proportion of DN3 cells generated. c) FACS analysis of LMPP cells co-cultured with OP9 cells in the presence of myeloid (GM-CSF, M-CSF, IL-3) cytokines for 6 days to initiate myeloid development. The numbers indicate the proportion of myeloid cells generated. d) FACS analysis of CLP cells co-cultured with OP9-DL1 cells in the presence of lymphoid (IL-7 and Flt3l) cytokines for 6 days to initiate T-cell development. The numbers indicate the proportion of DN2 cells generated. e) FACS analysis of CLP cells co-cultured with OP9 cells in the presence of lymphoid (IL-7 and Flt3l) cytokines for 6 days to initiate B-cell development. The numbers indicate the proportion of B cells generated. f) Quantitation of cell numbers obtained during in vitro differentiation experiments outlined in (b–e) at 6 days. Each dot represents data of cells isolated from an individual mouse, horizontal bars represent the mean and the dotted line represent the original cell number plated. p values corresponding to the significance using T-test are shown.

