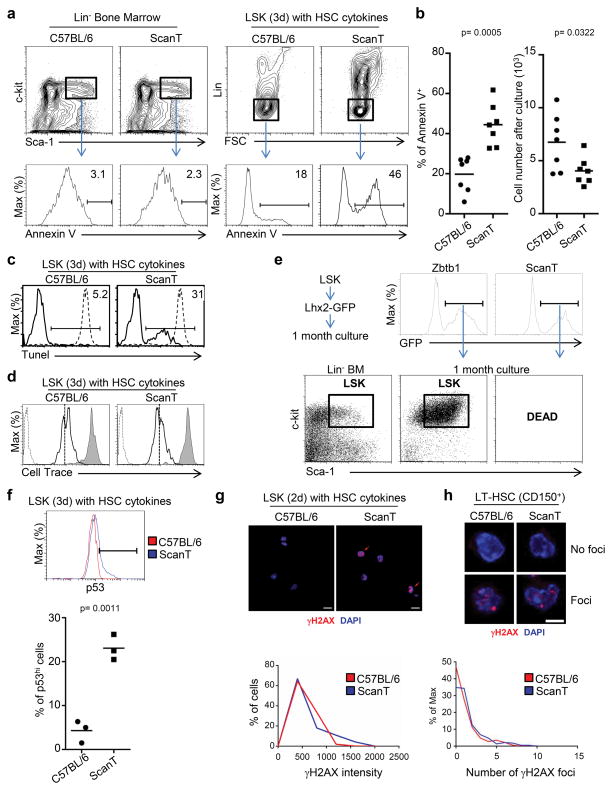
Figure 2. Zbtb1 protects hematopoietic progenitors from apoptosis.
a) FACs analysis for annexin V staining in LSK (Lin−Sca1+cKit+) cells ex-vivo or after 3 day culture with SCF, IL-6 and IL-3. The gate indicates the proportion of Annexin V+ cells within the PI− live cells. b) Scatter plots representing the percentage of annexin V+ cells obtained in (a), and the number of cells obtained after 3 days in culture. Each dot corresponds to data from one mouse and horizontal bars represent the mean. c) Histogram showing the percentage of Tunel+ cells after culture. The dashed line represents T-cells treated with DNAse I before the Tunel assay as positive control. Data is representative of two mice. d) FACS analysis of cell trace dilution in cultured LSK cells as in (a), the gray histogram represents non-proliferating T-cells maintained with IL-7 for 3 days and the dashed line represents cells not stained with the cell trace dye. The vertical dotted line is placed as reference for comparison and the stripped histogram represent cells non-labeled with Cell Trace to indicate the background cell trace fluorescence. This experiment is representative of three independent experiments with two mice per condition. e) LSK cells were transduced with the TrmpVIR-Lhx2 retrovirus, transduced GFP+ cells were sorted and kept in culture for one month. The dot plot shows the LSK phenotype of generated cell lines. f) FACS analysis of intracellular p53 levels in cultured LSK cells as in (a). The scatter plot represents the proportion of p53hi cells, each dot corresponds to data from one mouse and horizontal bars represent the mean. g) Confocal microscopy to identify γH2AX fluorescence in LSK cells after 2 day culture with SCF, IL-6 and IL-3 as in (a). Red arrows indicate cells that present increased γH2AX staining. The histogram represents the Mean Fluorescence Intensity of γH2AX within the DAPI+ region corresponding to the nucleus. h) Immunofluorescence showing γH2AX foci in LT-HSCs. The histogram represents the number of γH2AX foci within the DAPI+ region corresponding to the nucleus. p values corresponding to the significance using T-test are shown. Data is representative of more than 3 independent experiments.

