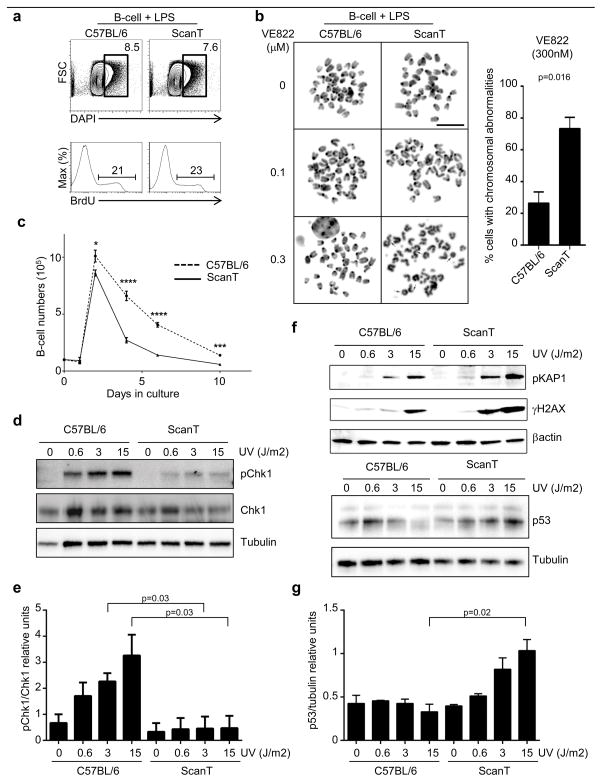
Figure 3. Zbtb1 protects B-cells from DNA damage in response to replication stress.
a) FACs analysis of DNA content and BrdU incorporation in isolated B-cells after 18hs LPS treatment to induce proliferation. Number represent the proportion of cells within the gates identifying cells that have initiated DNA synthesis. b) Metaphase spreads to identify the chromosomal integrity of proliferating B-cells after treatment with suboptimal concentrations of the ATR inhibitor (VE822). Arrows indicate chromosomal aberrations (deletions or fusions). The column graph represents the percentage of cells presenting chromosomal abnormalities after treatment with 0.3μM of VE822. Data corresponds to three independent experiments c) Analysis of B-cell numbers in culture in the presence of LPS stimulation, (Mean ± SD, n=6). d) Western-blot 90 minutes after UV irradiation in proliferating B-cells. e) Quantitation of the relative intensity observed in (d) from three independent experiments. f) Western-blot of proliferating B-cells 5 hours after UV irradiation. g) Quantitation of the relative intensity of p53 observed in (f) from two independent experiments. p values corresponding to the significance using T-test are shown.

