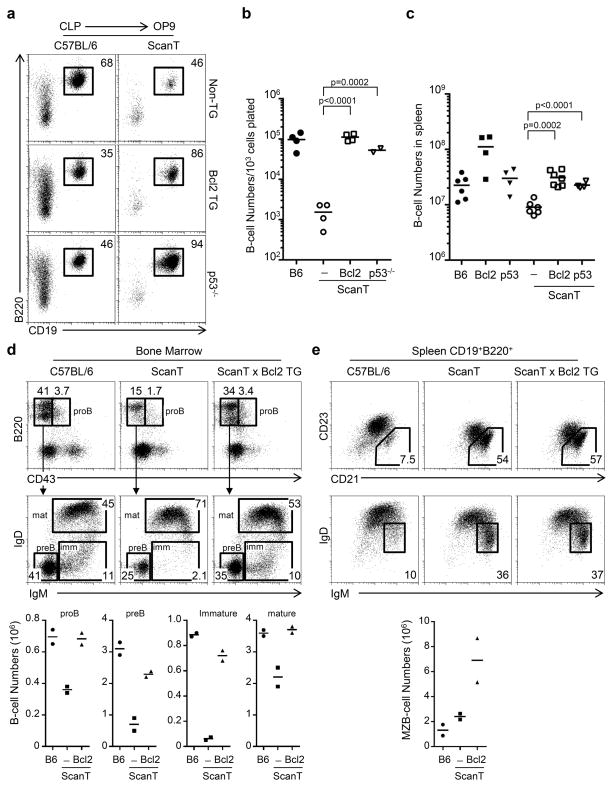
Figure 4. Transgenic Bcl2 expression and p53-deficiency rescue B-cell development of ScanT progenitors.
a) FACs analysis of in vitro B-cell differentiation in OP9 co-cultures of sorted CLP cells from the indicated strains. The numbers represent the proportion of cells within the gates. b) Scatter plot representing the number of cells obtained under the differentiation conditions in (a). c) B-cell numbers (CD19+B220+) in spleen. Each dot represents data from a mouse. Horizontal bars represent the mean value. p values corresponding to the significance using T-test are shown. Data in (a) is representative of 4 independent experiments. d) Analysis of immature B-cell populations in Bone marrow from the indicated mice corresponding to proB, preB, immature (imm) and mature (mat) B-cells. The numbers represent the percentage of cells within the indicated gates. Below is the quantitation of cell numbers corresponding to each subpopulation in two mice from each strain. e) FACs analysis of B-cells in spleen, numbers represent the proportion of events within each gate, which correspond to Marginal Zone B-cells (CD21+CD23− and IgMhiIgDlo), data is representative of two mice from each strain. Below is the quantitation of Maginal Zone B-cell numbers corresponding to each subpopulation in two mice from each strain

