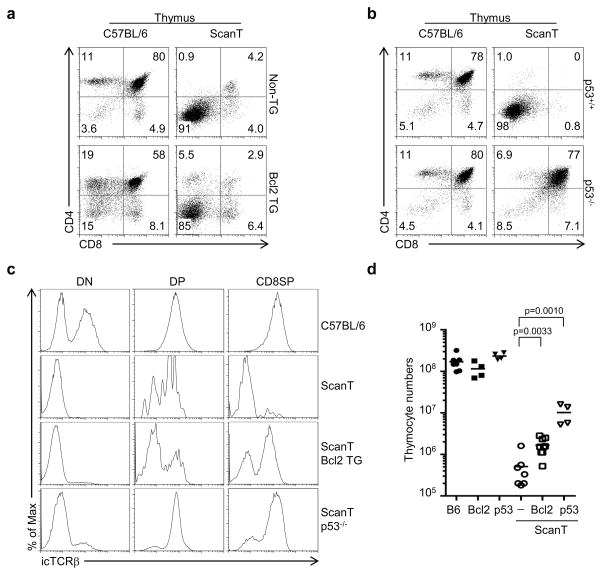
Figure 6. Transgenic Bcl2 expression and p53 deficiency fail to rescue the late stages of T-cell development in ScanT mice.
FACs analysis of the indicated strains (a and b). Numbers indicate the percentage of cells within the gates. c) Intracellular TCRβ staining of the indicated gated thymocytes. d) Scatter plot showing thymocyte numbers in the indicated mice, each dot corresponds to a mouse, horizontal bars indicate the mean. p values corresponding to the significance using T-test are shown.

