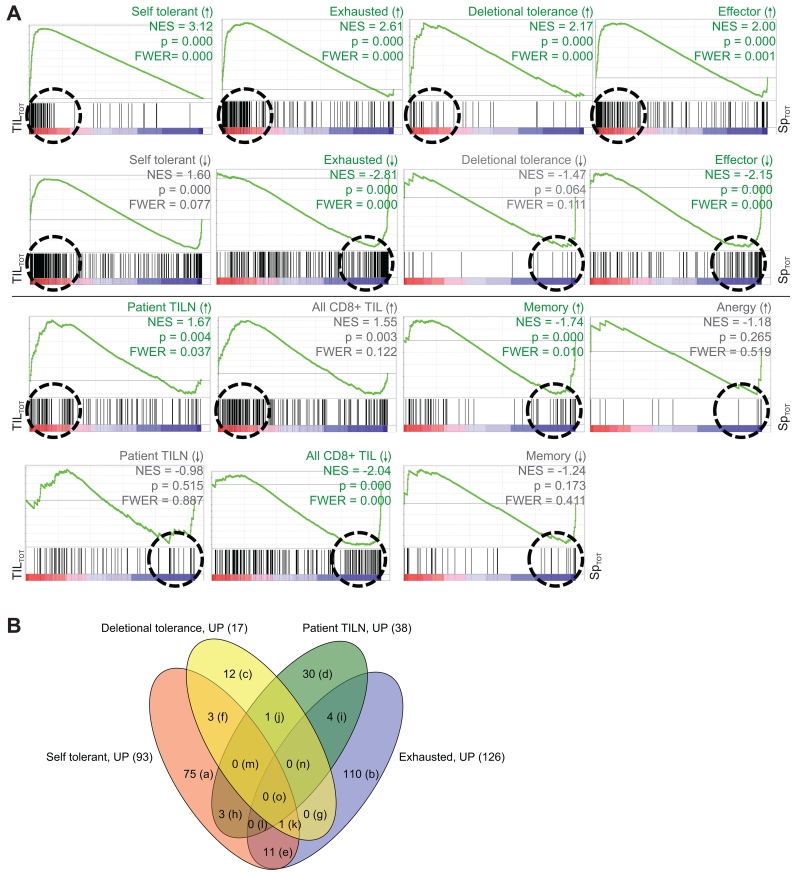
FIGURE 3.
Genome-wide mRNA expression of tumor-specific TIL from the CT26 tumor is similar to transcription profiles of other hypofunctional CD8+ T cells; similarities are driven by distinct gene expression. Genome-wide mRNA expression of TASPR T cells, acquired as described in Figure 2A, was simultaneously compared to other published CD8+ T cell transcriptional profiles for similarities by gene set enrichment analysis (GSEA) (30). (A) Plots show enrichment of genes associated with the indicated T cell profile, or “gene set.” Vertical black lines show where gene sets match genes expressed by TASPR T cells from the tumor (red, TILTOT15 = TIL and TILV) and spleen (blue, SpTOT16 = SpTV and SpV). The Normalized Enrichment Scores (NES) reflect the degree to which a gene set is overrepresented at the extremes of the entire ranked list of gene expression differences between TASPR T cells from the tumor and spleen; an NES value farther from 0 indicates greater enrichment of the indicated profile genes among TASPR T cells from the tumor (positive NES) or spleen (negative NES). The green line is a visual representation of gene set enrichment along the ranked list. The Leading Edge, roughly shown by a dashed circle, includes the core genes from a gene set that contribute most to the deviation of an NES from 0. Profile gene sets were determined to significantly cluster among genes highly expressed by TASPR T cells from the tumor or spleen when p-value ≤ 0.001 (30) and familywise error rate ≤ 0.05 (FWER, which suggests the probability of type 1 errors), and are delineated by green rather than grey labels. (B) The majority of Leading Edge genes differ between the hypofunctional CD8+ T cell profiles. These core genes drive the NES away from 0 in the Leading Edge (circled in A) and are compared in the Venn diagram and Supplemental Table 2.

