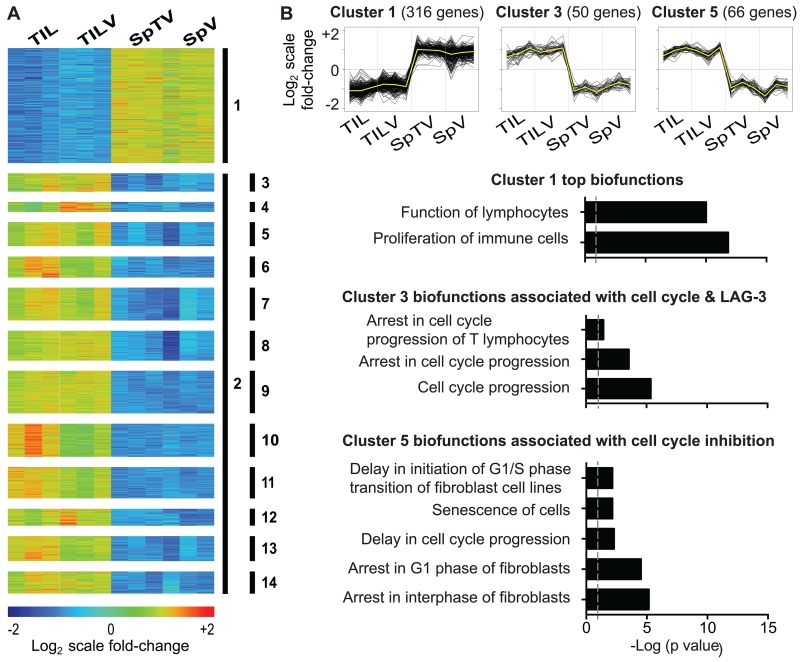
FIGURE 5.
Molecular profile of tumor-specific TIL from the CT26 tumor highlights transcriptional regulation of cell cycle inhibition. The molecular profile of TASPR T cells acquired in Figure 2A was analyzed in clusters for enrichment of biological pathways. (A) K-means clustering (KMC) divided differentially-expressed genes into 13 clusters for focused pathway analyses. Heat map shows log2-transformed expression intensities mean-centered at the probe level. (B) Pathway analysis of gene products from Clusters 1, 3, and 5 revealed corresponding biofunctions enriched in TASPR T cells from the spleen and tumor. Grey dashed lines represent p value = 0.05.

