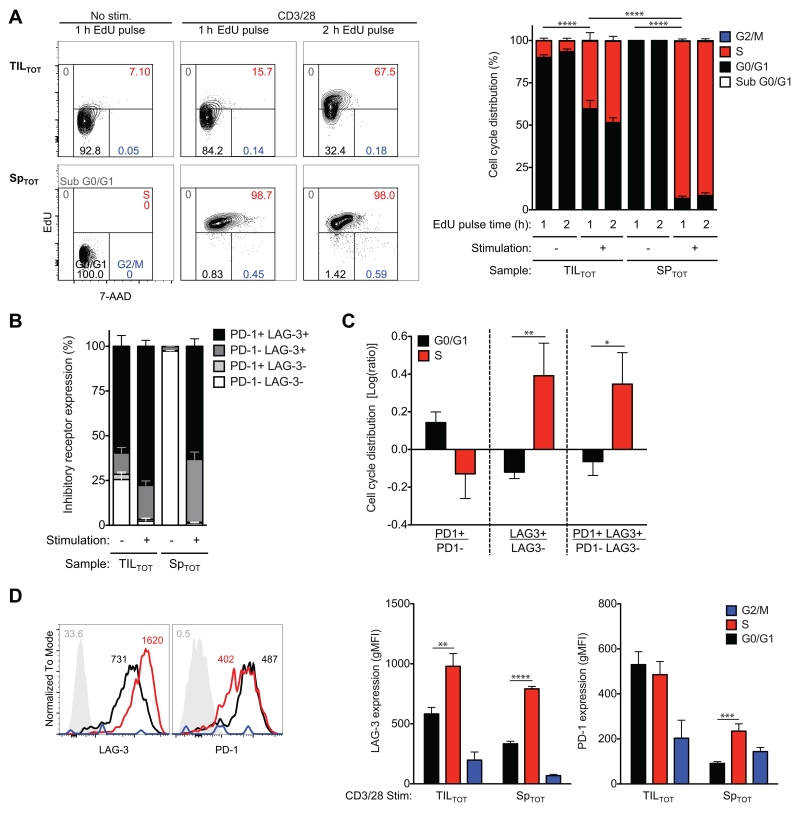
FIGURE 6.
Slowed cell cycle progression of CD8+ T cells in the CT26 tumor corresponds to a novel pattern of inhibitory receptor expression predicted by the molecular profile of TIL. Total CD8+ T cells from CT26 tumors (TILTOT) and spleens (SpTOT) from timelines shown in Figure 2A were untreated or treated with antibodies to CD3 and CD28 for 48 h before a 1 h (or indicated time) pulse with the thymidine analogue EdU. Flow cytometric analyses identified cell cycle phase and inhibitory receptor expression of live CD8+ T cells. (A) Cell cycle phase was resolved by staining for EdU and by the DNA dye 7-AAD. Frequencies are shown in sub G0/G1 (grey), G0/G1 (black), S (red), and G2/M (blue) phase. (B) Inhibitory receptor expression (PD-1 and LAG-3) was determined in the presence and absence of stimulation. (C) Inhibitory receptor expression on TILTOT during G0/G1 and S phase was determined. (D) Representative histograms (left) of naive CD8+ T cells from spleen (grey, negative control) and stimulated TILTOT cells [G0/G1 (black), S (red), and G2/M (blue) phase] are shown. Numbers indicate the gMFI. At this time point (48 h), frequency of synchronized T cells in G2/M phase (blue) was too small to confidently determine inhibitory receptor expression. All data (right) represent three independent experiments, n=3-10 biological replicates per group, error bars=SEM.

