
Figure 1. Netrin-1 receptor expression by human CD4+ T lymphocytes.
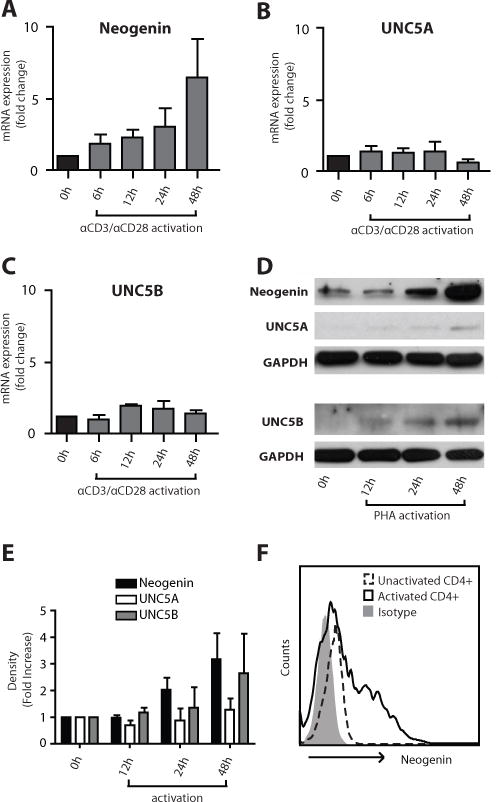
The expression of known Netrin-1 receptors was analyzed at the mRNA level by quantitative PCR (Panels A–C), at the protein level by Western blot analysis (Panels D–E) and by FACS after 48hrs activation (Panel F). Panels A–C show the mean fold change in mRNA expression ±SEM. In Panel D, induced expression of neogenin, UNC5A and UNC5B is illustrated and Panel E illustrates densitometric analysis of n=3 independent Western blots. The illustrated data in Panels A-F are representative of n=3 independent experiments.