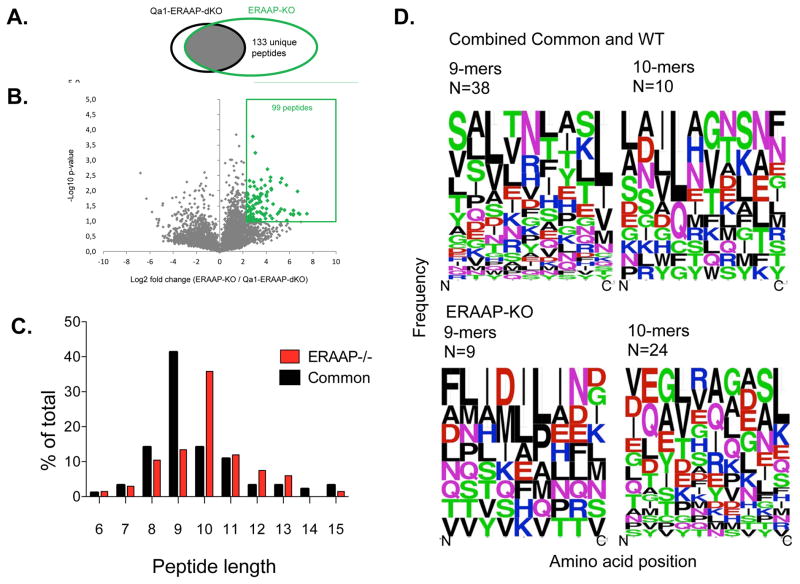
Fig 2. A subtractive approach defines Qa-1b -associated peptides in ERAAP-deficient cells.
A. Venn diagrams showing the subsets of Qa-1b -associated peptides found in Qa-1b + ERAAP-KO cells versus Qa-1b - ERAAP-double KO cells. B. Volcano plots, showing that some peptides were significantly over-expressed in ERAAP-KO-cells compared to Qa-1b -ERAAP-DKO cells (> 5 fold, p < 0.1, two-tailed Student’s t test). The numbers indicate distinct peptides found in each category. The average of two independent experiments is shown. C. The proportion of peptides of distinct lengths either specific to ERAAP-deficient cells, or common to both ERAAP-KO and WT cells. D. Weblogo plots, showing the amino acid composition of 9- or 10-reside long Qa-1b -associated peptides, either specific to ERAAP-deficient cells or common to both ERAAP-deficient and WT cells. Amino acids are represented by their single letter code, and the size of the letter is proportional to the frequency with which that amino acid occurs at the position indicated on the X-axis. The color of the letter indicates the chemical nature of the amino acid as follows: Green-polar, Black-hydrophobic, Red-acidic, Magenta- Blue-basic. N indicates the numbers of peptides in each group.

