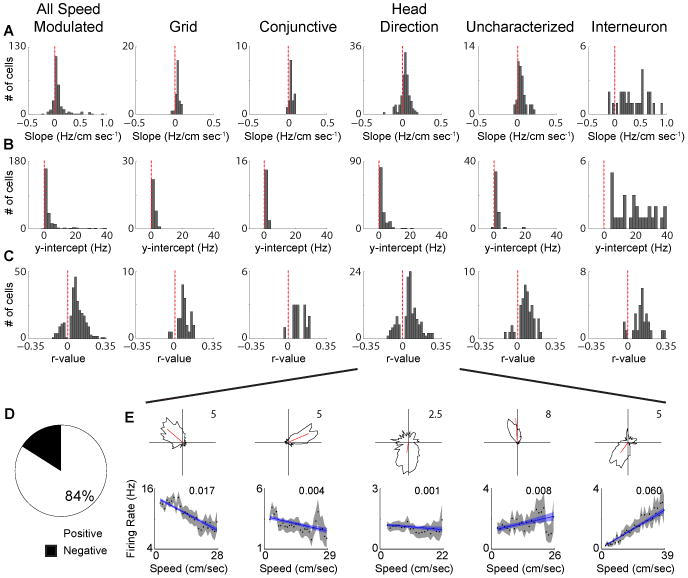
Figure 2.

A subset of negatively speed modulated MEC cells. A. Distributions of the slope between firing rate and running speed. B. Distributions of y-intercepts of relationship between firing rate and running speed.C. Distributions of r-values between firing rate and running speed. D. Proportion of positively and negatively speed modulated cells. E. Head direction polar plots (top) and firing rate versus running speed plots (bottom) for five head direction cells with significant firing rate speed modulation, but with varying magnitudes and polarities of speed modulation. The inset value in each plot is the firing rate pseudo-r2 value for the linear fit.
