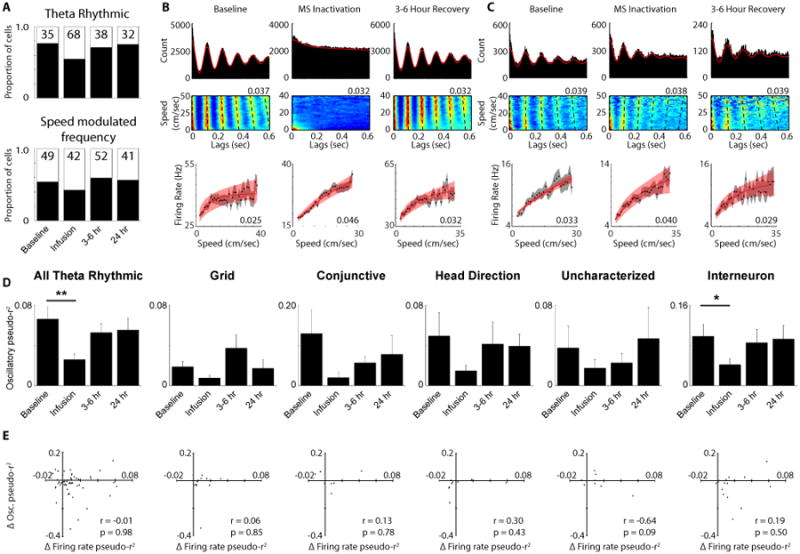
Figure 6.

Disruption of oscillatory speed signal during MS inactivation. A. The proportion of significantly theta rhythmic cells (top) and the proportion of theta rhythmic cells with significantly speed modulated oscillatory frequencies (bottom). B. Traditional spike time autocorrelation (top), spike time lags as a function of running speed density plot speed (the value at the top right corner of each plot indicates the maximum conditional probability of firing (red) shown in the plot and the sum of each running speed row equals a conditional probability of 1) (middle) and firing rate versus running speed plot (bottom) for an example interneuron. C. Same plots as in B, but for an interneuron that remains theta rhythmic during MS inactivation. D. Mean +/- SEM pseudo-r2 values between oscillatory frequency and running speed for all theta rhythmic cells and broken down by each individual cell type as well. E. Lack of a relationship between the change in firing rate pseudo-r2 values and the change in oscillatory frequency pseudo-r2 values between baseline and MS inactivation for all cell types. * p < 0.05, ** p < 0.0005
