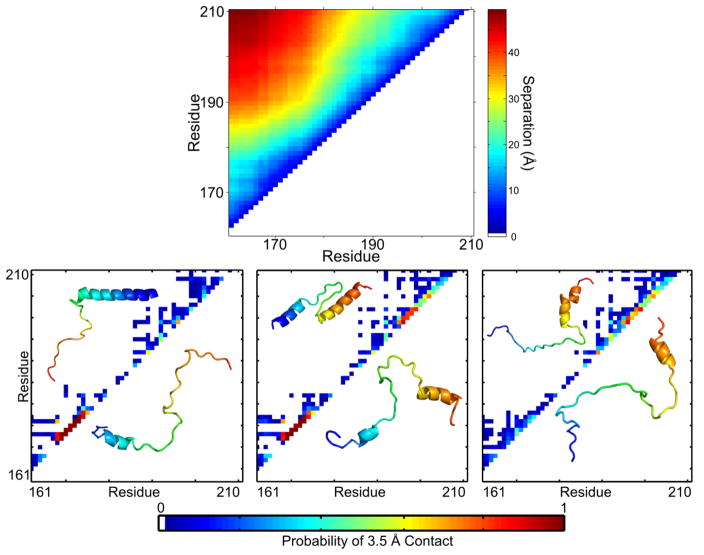
Figure 3. TnIC favors an extended conformation with specific conformational propensities in the open state.
Monte Carlo simulations of TnIC in solution show distinct conformational preferences. Top panel: An average of 10,000 conformers shows that all have residue-residue pairwise distances increasing over residue separation, indicating an extended conformation. Plot produced from published data.51 Bottom panel: The conformers can be clustered by 3.5 Å contact maps, which focus on secondary structure signatures. The three most populated clusters are similar to conflicting, published literature models of TnIC. Contact map inserts show published structures (top left) and snapshots of simulated structures (bottom right). Adapted with permission from J. Am. Chem. Soc. 137(37), Metskas and Rhoades, Conformation and Dynamics of the Troponin I C-terminal Domain: Combining Single-Molecule and Computational Approaches for a Disordered Protein Region, 11962-9, 2015.

