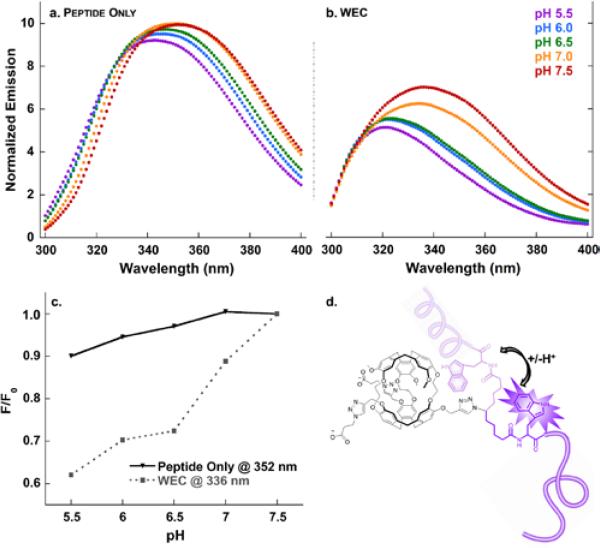
Figure 2.
pH titration monitored by Trp fluorescence for a. azido-EALA peptide; b. water-soluble EALA-cryptophane (WEC); c. plot of F/F0 for the λmax of peptide only (352 nm) and WEC (336 nm) as a function of pH change; and, d. representation of alpha-helical and disordered peptide-cryptophane interaction. Samples (30 μM) were in 10 mM sodium phosphate buffer over the pH range 5.5-7.5 at 298 K.

