Figure 7.
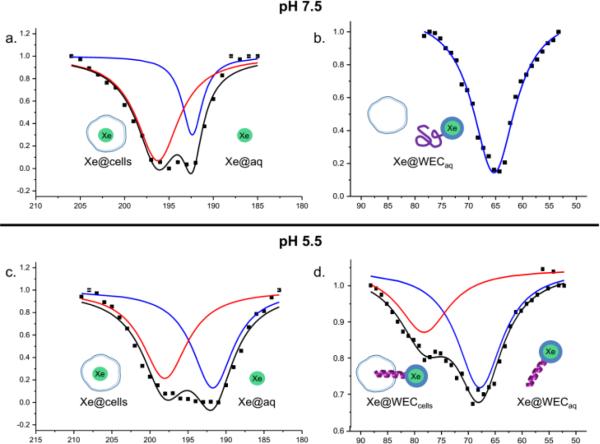
Hyper-CEST 129Xe NMR spectra for 5-10 μM WEC in 10 mM sodium phosphate buffer with 0.1% pluronic in a suspension of 10 × 106 cells/mL. Data were collected at pH 7.5, a. Xe@cells-red trace, Xe@aq-blue trace; b. Xe@WECaq; and at pH 5.5, c. Xe@cells-red trace, Xe@aq-blue trace; d. Xe@WECcells-red trace and Xe@WECaq blue trace. Exponential Lorentzian fits are shown as coloured, solid lines and the corresponding sums are shown as solid black lines.

