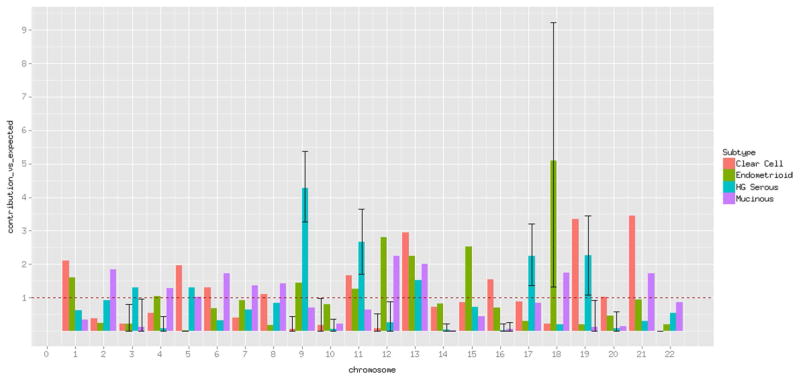
Fig. 1.
Contribution to the heritability by chromosome versus expected. Black vertical lines show the 95 % confidence intervals approximated through jackknifing up to 1000 times. These are only shown for those instances that do not overlap with 1 to facilitate visualization. The same graph with all confidence intervals is included as supplementary figure 2

