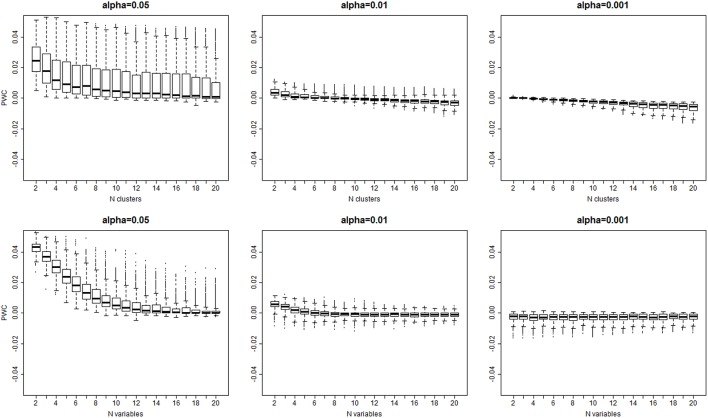
Figure 4.
Distribution of the error rate () vs. the true number of clusters (top panel), and the true number of variables bottom panel) for different significance levels α = 0.05, 0.01, 0.001. The error rate decreases with larger number of variables and larger number of clusters that are both associated with larger separation of clusters (See Supplement Figure 3).

