
Figure 6.
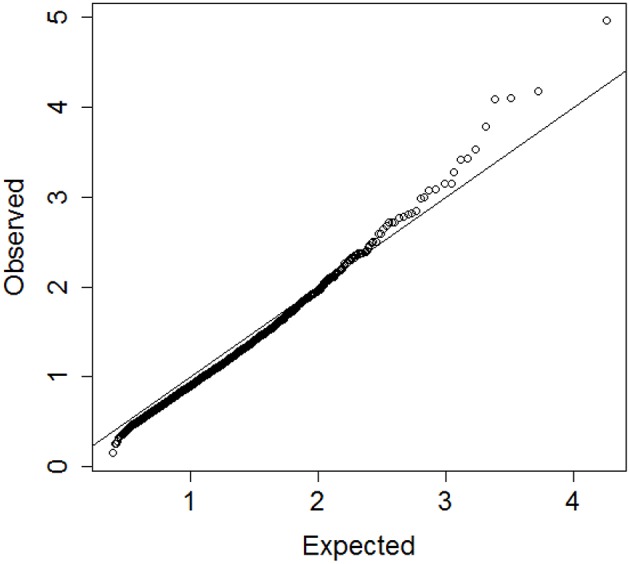
QQplot of the observed heights of the branch nodes in the dendrogram of hierarchical clustering of 4704 profiles of 19 biomarkers in participants of the Long Life Family Study (y-axis) and the expected heights based on 10 resampling of the data. The departure from the diagonal line suggests that there are significant clusters in the data.