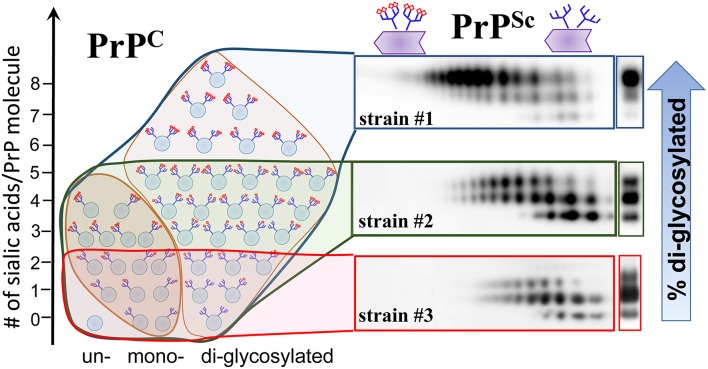
Figure 4.
Schematic diagram illustrating that PrPSc strains recruit PrPC isoforms selectively according to PrPC sialylation status. While strain #1 recruits sialoglycoforms of PrPC without noticeable preferences, hypersialylated PrPC are preferentially excluded from the strain the #2 and even more so from strain #3. As a result of strain-specific exclusion of highly sialylated PrPC (illustrated by the 2D Western blots), the ratios of di- vs. mono-glycoforms within PrPSc changes in a strain-specific manner, as shown by 1D Western blots (right hand side). PrPC molecules are shown as blue circles and sialic acid residues—as red diamonds.

