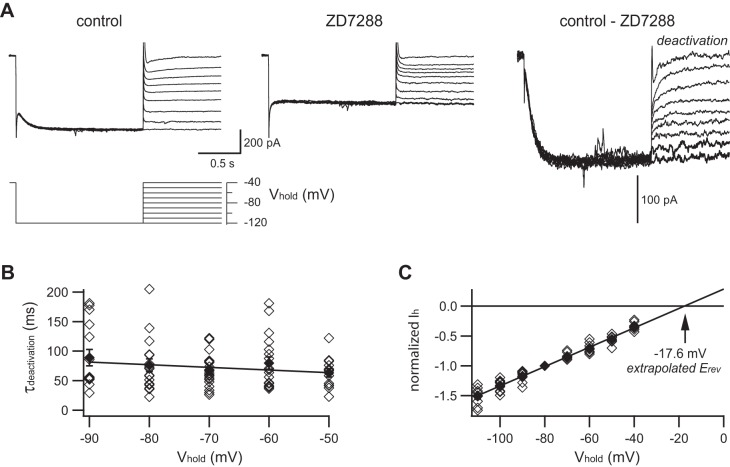
Fig. 3.
Deactivation kinetics and reversal potential of Ih in rat SCG neurons. A: each family of membrane currents was in response to the voltage protocol (bottom). This is a different neuron than shown in Fig. 1. Currents were measured in normal saline (top left) and after addition of 15 μM ZD7288 (top middle). Difference currents are taken as Ih (top right). B: the time constant for deactivation (τdeactivation) was determined by fitting a single exponential to the current relaxations after stepping from −120 mV to test voltages ranging from −50 to −90 mV. The voltage dependence of τdeactivation was fit to a straight line (see Eq. 6). C: the reversal potential (Erev) of Ih was determined by plotting instantaneous current amplitudes after stepping from −120 mV to test voltages ranging from −40 to −110 mV. Data in each neuron were normalized to the response at −80 mV. A straight line fit to the data predicts an extrapolated reversal potential of −17.6 mV. Data from 18 neurons (◇); means ± SE (⧫).

