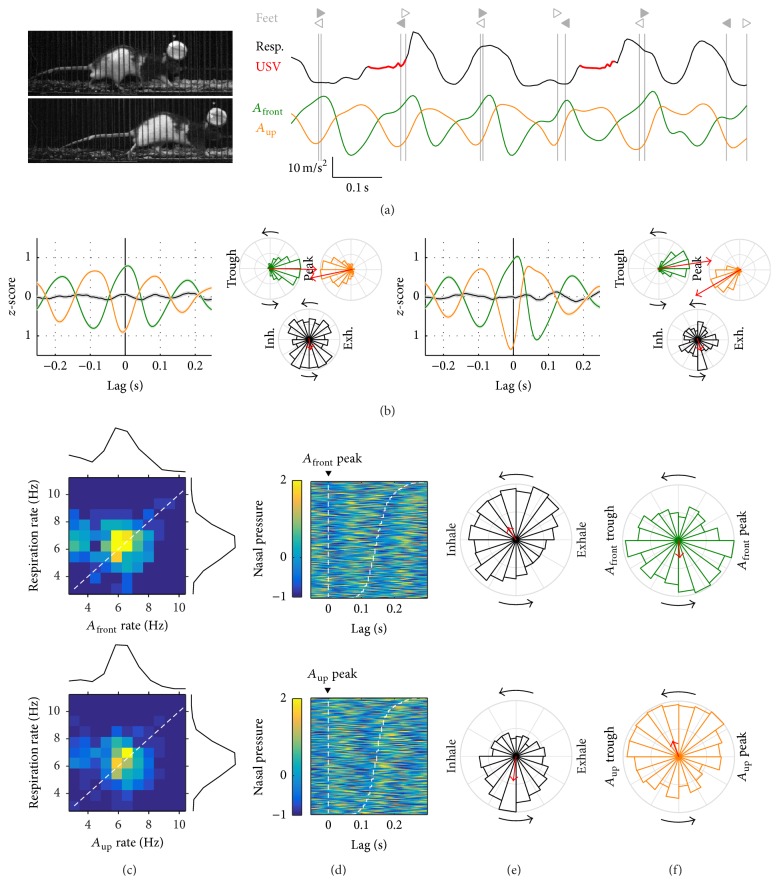
Figure 5.
Trotting. (a) Example of trotting behavior. Left: video frames coinciding with right hindlimb (top) and right forelimb (bottom) contact. Right: respiration (intranasal pressure, a.u.) and frontwards (A front) and upwards (A up) head acceleration. Symbols as in Figure 4(a). Max. speed at this progression was 0.61 m/s. (b) Alignment of respiration and acceleration signals to footsteps from hind- (left panels) and forelimbs (right panels) as in Figure 4(b). (c) Joint distribution of mean respiratory rate and head acceleration rate for each walking episode with marginal distributions on the sides (top: A front; bottom: A up, as in Figure 4(c)). (d) Alignment of respiration to all acceleration peaks detected in the analyzed trotting progressions (as in Figure 4(d)). (e) Phase locking of the respiratory cycle to the acceleration peaks. (f) Phase locking of the acceleration cycle to the peak of exhalation.

