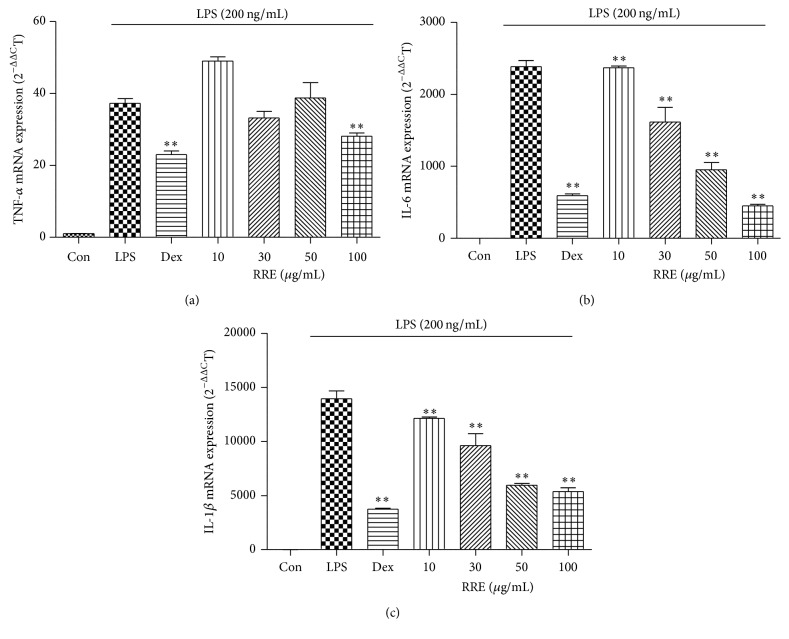
Figure 2.
Effects of RRE treatment on LPS-induced (a) TNF-α, (b) IL-6, and (c) IL-1β mRNA expression in RAW 264.7 cells. Cells were pretreated with RRE for 1 h and stimulated with LPS for an additional 6 h. mRNA levels were measured by real-time RT-PCR. Data represent the mean ± SD of duplicate determinations from three independent experiments. ∗∗ p < 0.001 was calculated from comparing with LPS-stimulation value.

