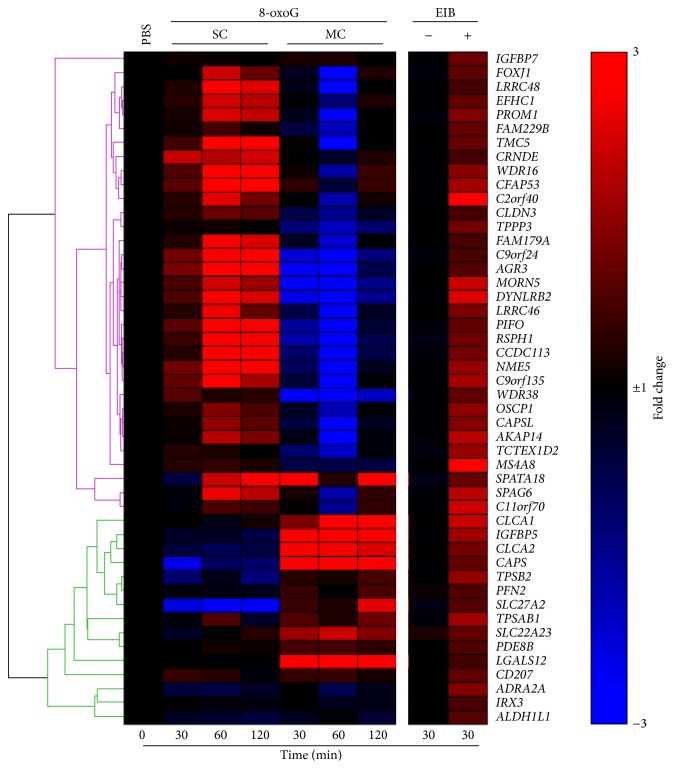
Figure 1.
Comparative gene expression between 8-oxoG challenged- and intensive exercise-exposed airways. The clustered heat map was constructed using the list of the most upregulated genes in airway epithelial cells from EIB positive (EIB+) individuals after 30 minutes of intensive exercise, as described in Hallstrand et al. [22]. This list of genes was compared to a list of the same genes from lungs challenged once (SC) or multiple times (MC). Top ranked gene list was obtained using Gene Expression Omnibus (GEO)'s built-in application GEO2R (http://www.ncbi.nlm.nih.gov/geo/geo2r/) and Hallstrand et al. GEO deposited dataset (GSE13785). Hierarchically clustered heat map was generated using GENE-E (Broad Institute, http://www.broadinstitute.org/).

