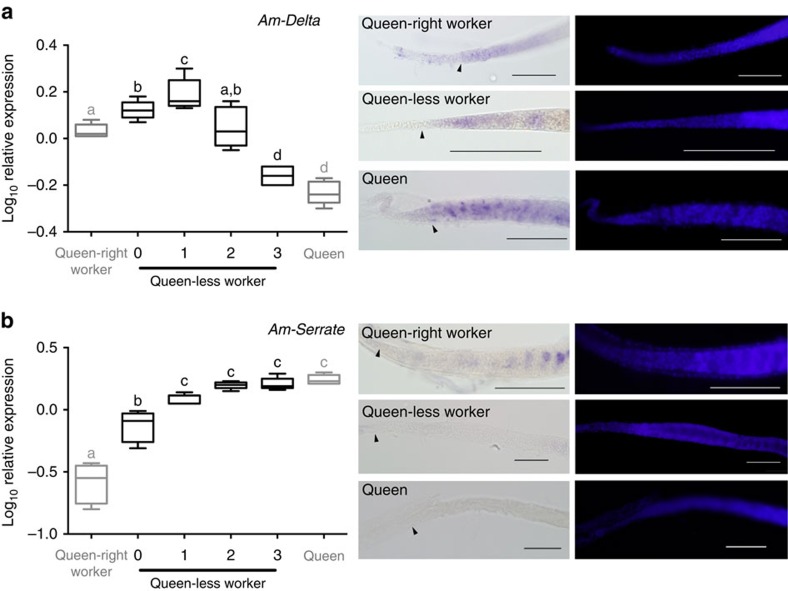
Figure 3. Differences in Notch activity are not associated with expression of ligands.
(a) Delta transcript levels increase transiently in queen-less worker bees as the ovaries begin to undergo cell differentiation, but transcript levels decline as vitellogenesis (deposition of yolk) begins. In situ hybridization reveals that Delta RNA is expressed throughout the germarium of queen-less, queen-right and queen ovarioles. (b) Serrate RNA levels increase steadily in the ovaries of queen-less worker bees, but in situ hybridization reveals that Serrate is not expressed in the germarium of queen-less, queen-right or queen ovarioles. qRT–PCR data are the mean of transcript levels (Log10) in five biological samples for each condition. Boxplot whiskers indicate minimum and maximum, the box is defined by 25th percentile, median and 75th percentile. Differences in target gene expression were determined by analysis of variance with a Tukey's post hoc test, statistical differences (P<0.05) are denoted by different letters. Following in situ hybridization ovaries were counter-stained with DAPI (right panels). Scale bars, 100 μm. Arrow heads indicate the border between cells of the terminal filament and germarium.

