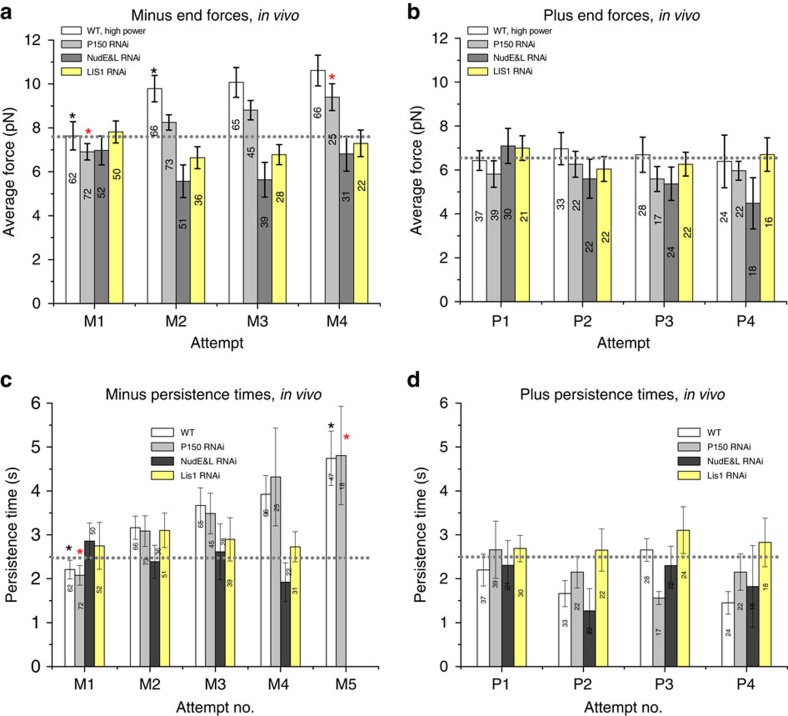
Figure 3. High power measurements in WT cells show LD adaptation reflects increased force persistence.
(a) The average peak forces of all LDs in the minus end direction shows a slight increase for WT and P150siRNA cells but not for LIS1 and NudE&L siRNA treated cells. (b) The average peak forces of all LDs in the plus end direction does not change. (c,d) In WT and P150 siRNA cells, the average persistence time of all attempts increases significantly in the minus end, but not in the plus end, direction. (99 LDs, excluding measurements in Fig. 1, were analysed for WT using high power trap to minimize the escapes). The average persistence time of minus-end LD attempts does not increase in LIS1 or NudE and L siRNA treated cells in any direction. Error bars=s.e.m. *P<0.05, t-test.

