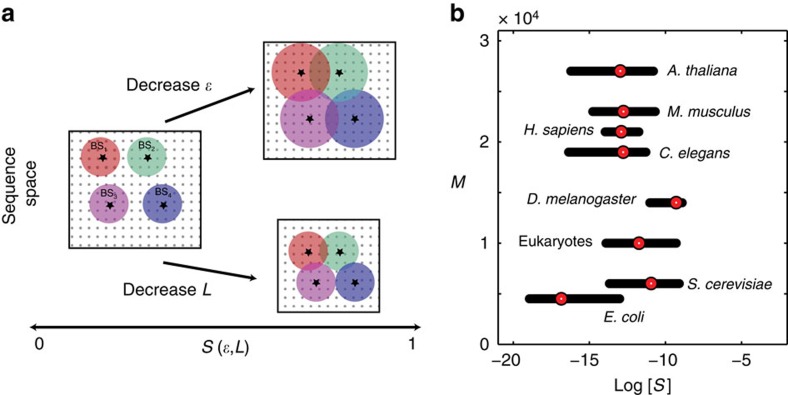
Figure 2. Binding site similarity S and number of genes M are basic determinants of crosstalk.
(a) Binding site similarity,  , determines the likelihood that a TF will bind non-cognate sites, if recognition sequences are of length L and the energy per mismatch is
  . A schematic diagram of sequence space packing by different TFs: sequences (dots) in a coloured circle are likely to be bound by the TF whose consensus is the circle's centre star. Smaller L contracts the sequence space and makes crosstalk (circle overlap) more likely (larger S); crosstalk is increased (larger S) also by smaller
  , which expands the circle radius. (b) Typical values for the number of genes, M, and binding site similarity,
  , across different taxa, estimated from genomic databases. For each organism, we find a distribution of S over its reported TFs (dots=median of the distribution, black bars=±1-quartile range; see Supplementary Note 2 for details).

