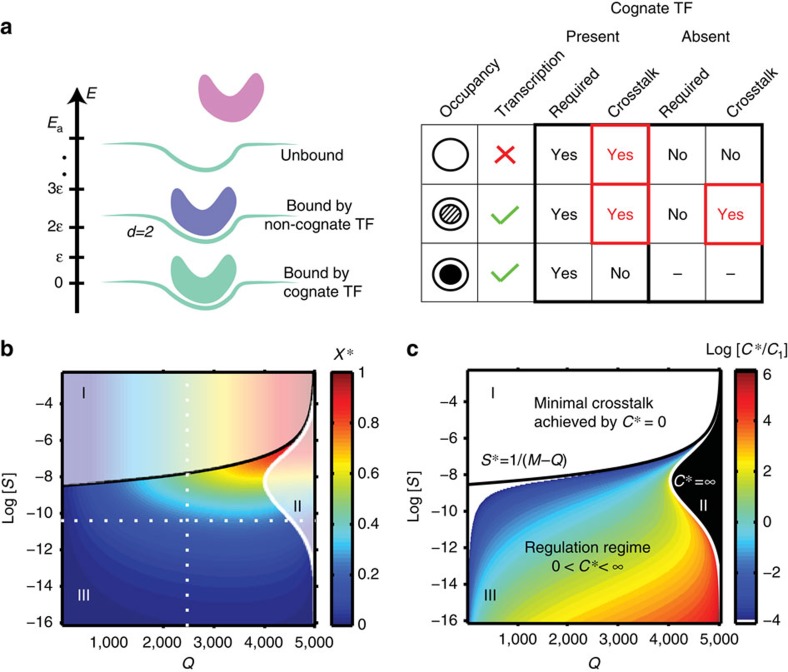
Figure 3. Basic model with one activator binding site per gene exhibits three distinct regulatory regimes.
(a) Each binding site can be in either of the three possible states with different corresponding energies: bound by a cognate factor (E=0, green molecule), bound by a non-cognate factor with d-mismatches ( , here a blue molecule with d=2), or unbound (E=Ea, pink molecule). The table shows which of these states lead to transcription and which of these outcomes is considered as crosstalk when the cognate TF is present and the gene is required to be active (left), or if it is absent and the gene is required to be inactive (right). (b) Minimal crosstalk X*, shown in colour, as a function of the number of coactivated genes Q and binding site similarity, S. Three different regulatory regimes are separated by black and white boundary lines (analytical expressions in Supplementary Note 1), identical between b and c. Dotted lines refer to the ‘baseline parameters' (Q=2,500, M=5,000, log(S)=−10.5—represents L=10,
  with dmin=2) that we use in all subsequent figures if not specified differently. (c) Optimal TF concentration, C*, that minimizes the crosstalk, relative to C1, the optimal concentration at baseline parameters. For high binding site similarity (large S), the crosstalk is minimized at C*=0 (white region, I: ‘no regulation regime'). For Q→M and intermediate S, the crosstalk is minimized at C*→∞ (black region, II: ‘constitutive regime'). In a large, biologically plausible intermediate regime, crosstalk is minimized at a finite non-zero TF concentration (colour, III: ‘regulation regime').

