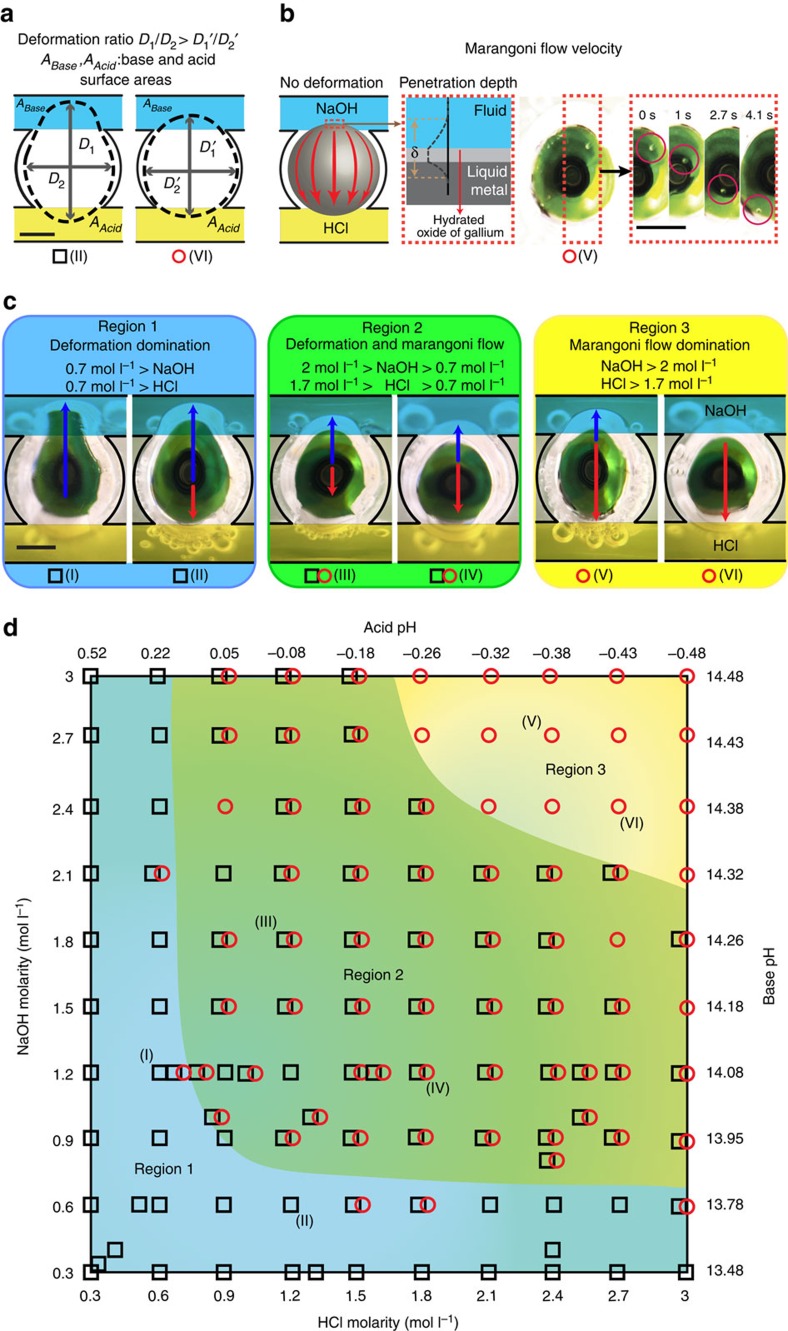
Figure 2. Dynamics of the liquid metal droplets under different HCl and NaOH concentrations.
(a) Schematic of the deformation ratio measurements for D1/D2 assessment. ‘Black square' indicates experiments with deformation dominating the dynamics and Marangoni flow dominant experiments are represented by ‘red circles'. (b) Demonstration of Marangoni flow and sequential snap shots shows a micro particle transferring from NaOH to HCl. The tangential skin flow displaced component, as a result of the Marangoni effect, contains a Galinstan layer near the surface of the droplet, an oxide layer and a layer of electrolyte also near the surface. A thickness of δ is used to define the effective thickness of this layer. (c) Selected enlarged images showing droplet deformation (in black arrows) towards NaOH, while Marangoni flow (in red arrows) direction is towards HCl. (d) Reference diagram of liquid metal droplet dynamics under a pH imbalance. Each ‘black square' or ‘red circle' presents an experiment with measurable deformation ratio or Marangoni flow, respectively (overlapped ‘black square' and ‘red circle' indicates experiments with both measurable Marangoni flow and deformation ratios without a distinct dominating effect), in various ionic concentrations of HCl and NaOH between 0.3 and 3 mol l−1 (pH ∼0.5 to ∼−0.5 for HCl and ∼13.5 to ∼14.5 for NaOH, respectively). The background of the reference diagram is coloured blue, green and yellow accordingly, to represent each of the regions (deformation, deformation–Marangoni and Marangoni regions) discussed in the text. Scale bars, 1 mm.

