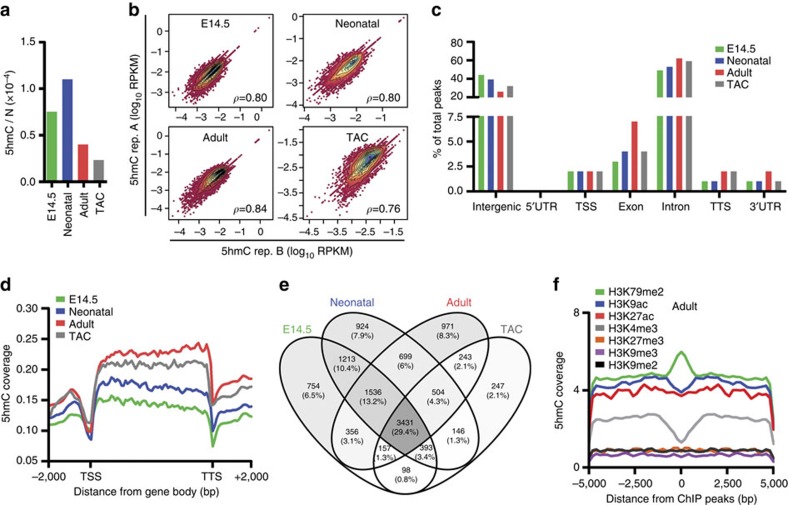
Figure 1. Genomic distribution of 5-hmC in mouse CMCs.
(a) Quantification of global 5-hmC in embryonic (E14.5), neonatal, normal adult (Adult) and hypertrophic adult (TAC) CMCs. (b) Density plots illustrating the correlation of the GB 5-hmC level in biological replicates (rep. A and rep. B) of embryonic (E14.5), neonatal, normal adult and hypertrophic (TAC) CMCs. For each plot, Pearson's correlation coefficient ρ is given. Intragenic levels of 5-hmC were quantified by counting the number of reads falling onto genes from the TSS to the TTS. Read number was normalized to library size and gene length (RPKM). (c) The presence of the 5-hmC peaks overlapping in the biological replicates on different genomic elements. TSS, transcription start site; TTS, transcription termination site; UTR, untranslated region. (d) Average 5-hmC coverage across the GB of all reference genes (UCSC version mm10) at each studied point. (e) Venn diagram of the number of genes associated with the identified peaks at the four studied points; peaks overlapping with exons and introns were considered for the analysis. (f) Profiles of 5-hmC distribution around the H3K79me2, H3K9ac, H3K27ac, H3K4me3, H3K27me3, H3K9me3 and H3K9me2 peaks identified with MACS software in adult CMCs.

